High resolution flow datasets for surface runoff, surface lateral runoff and drainage pathways from 1 ha sized hydrologically isolated plots.

N - Datasets

Hawkins, J. M. B. 2023. High resolution flow datasets for surface runoff, surface lateral runoff and drainage pathways from 1 ha sized hydrologically isolated plots. Rothamsted Research. https://doi.org/10.23637/rothamsted.98y67

AuthorsHawkins, J. M. B.
Abstract

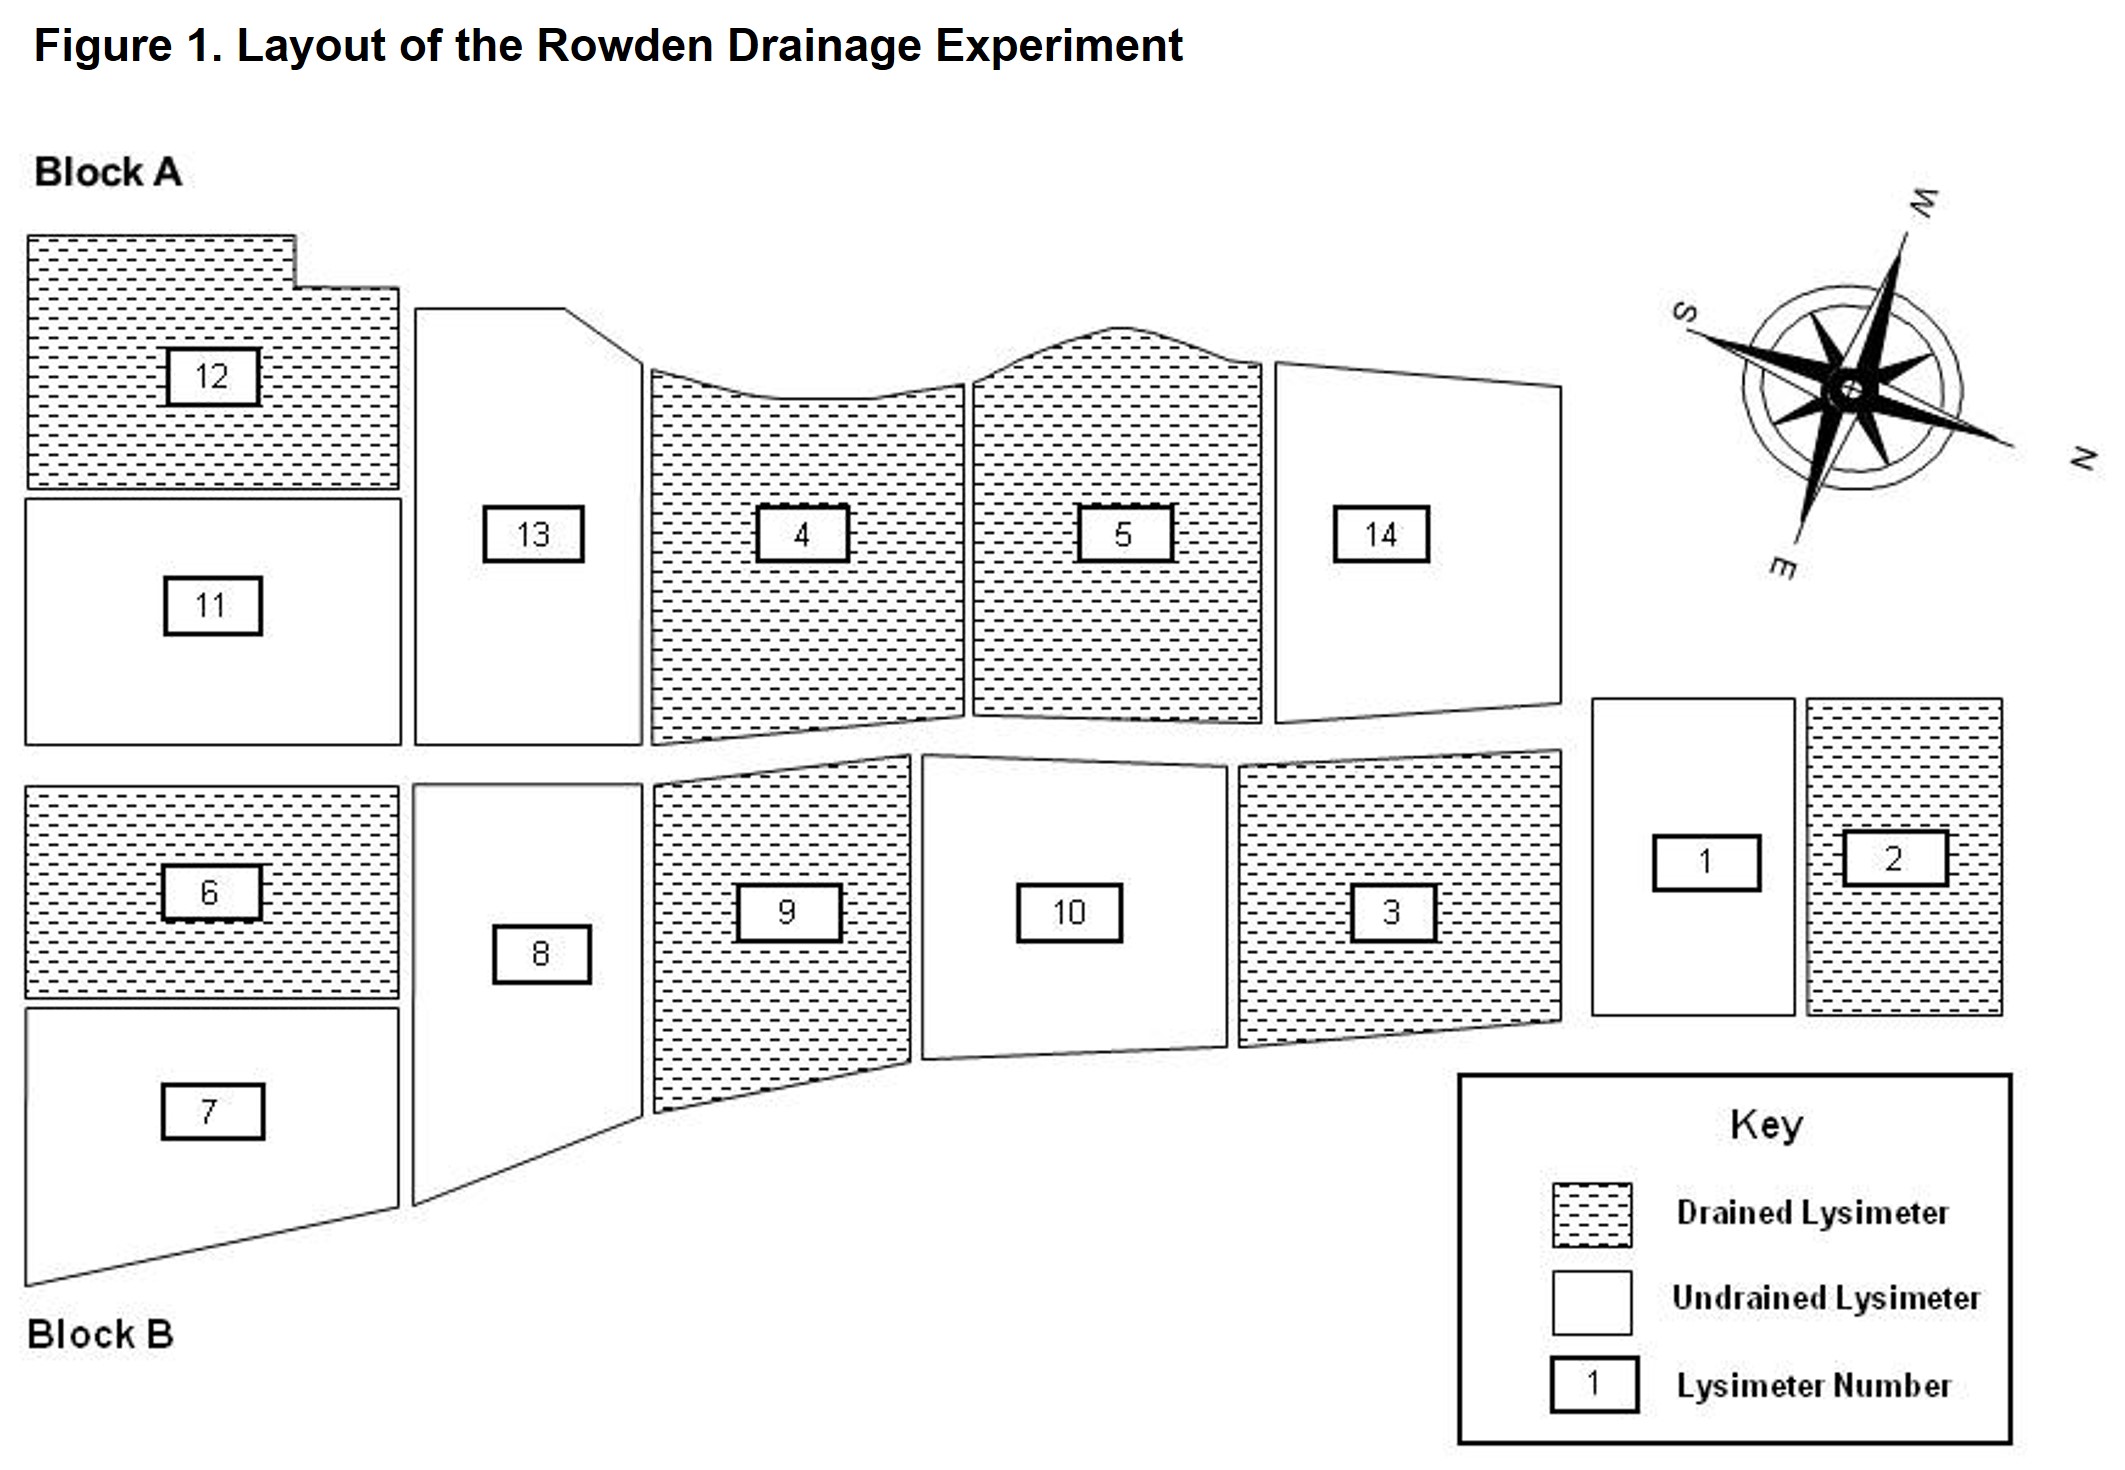
This dataset describes hydrology and rainfall data from a site known as the Rowden Drainage Experiment, which has 14 field-scale (1 ha sized) lysimeter plots. The experimental site was established in 1982 to primarily investigate the effects of land drainage and inorganic fertilizer input on herbage production, animal performance and nutrient losses from permanent and reseeded grassland overlaying impervious subsoils.

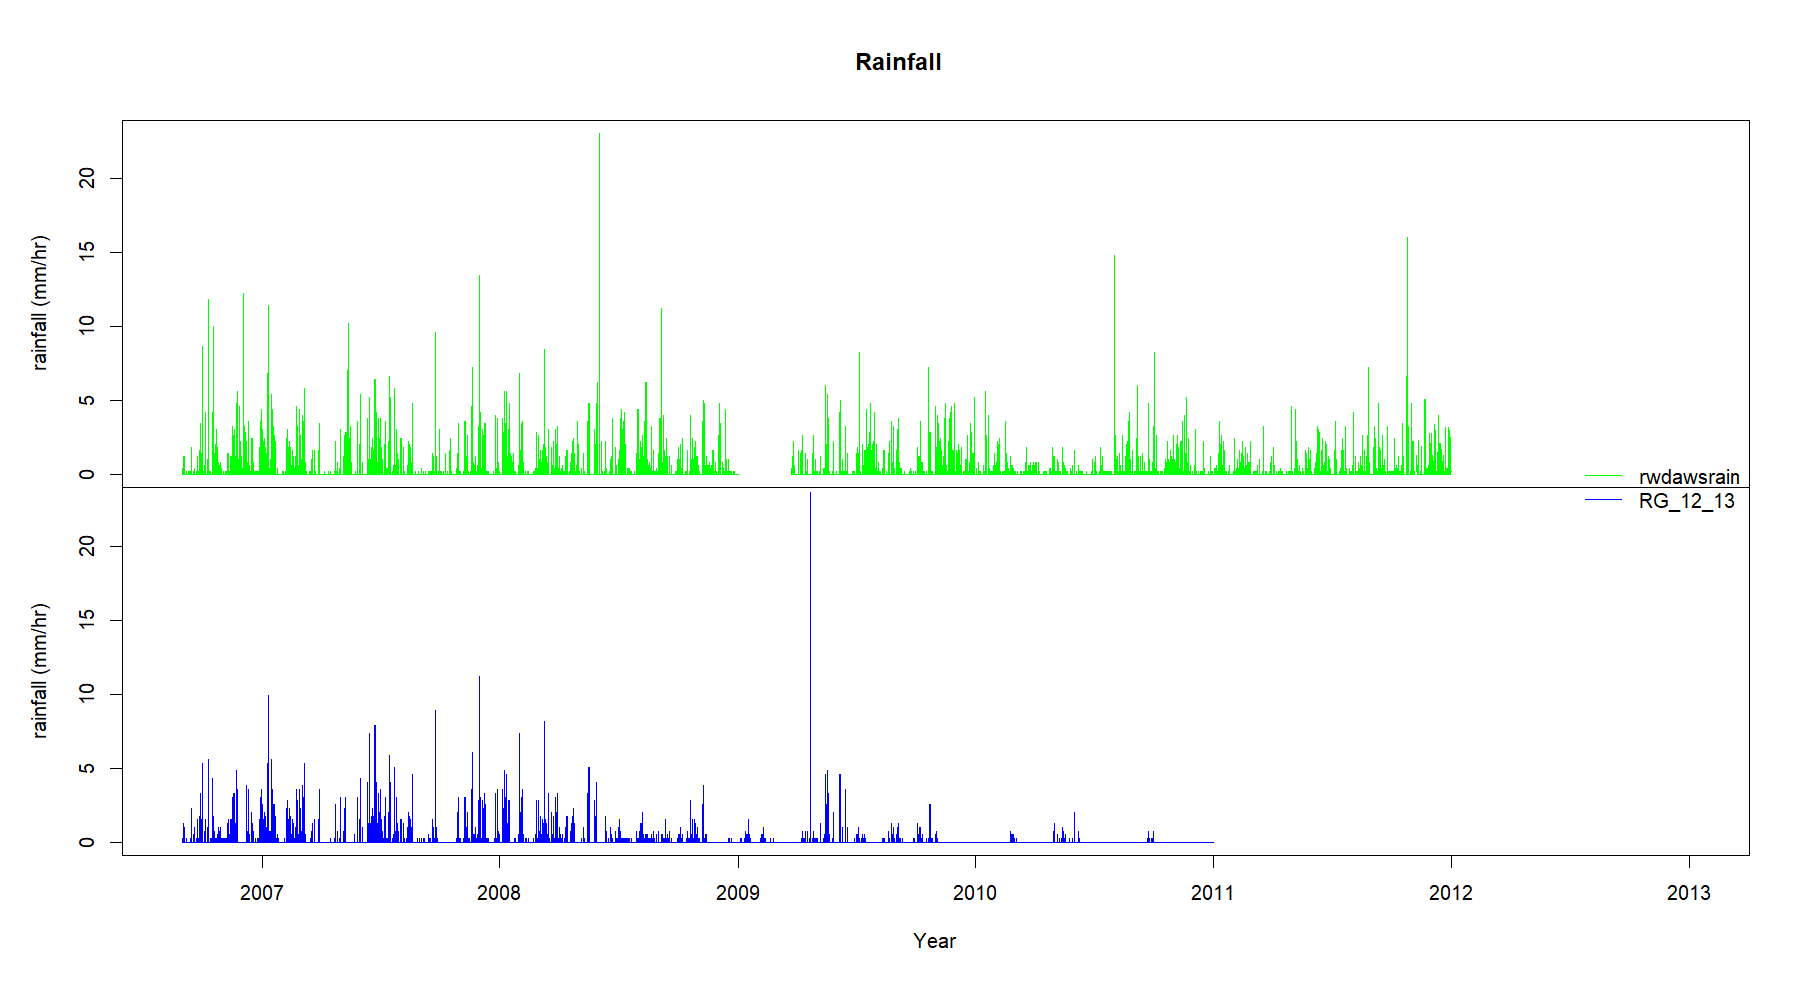
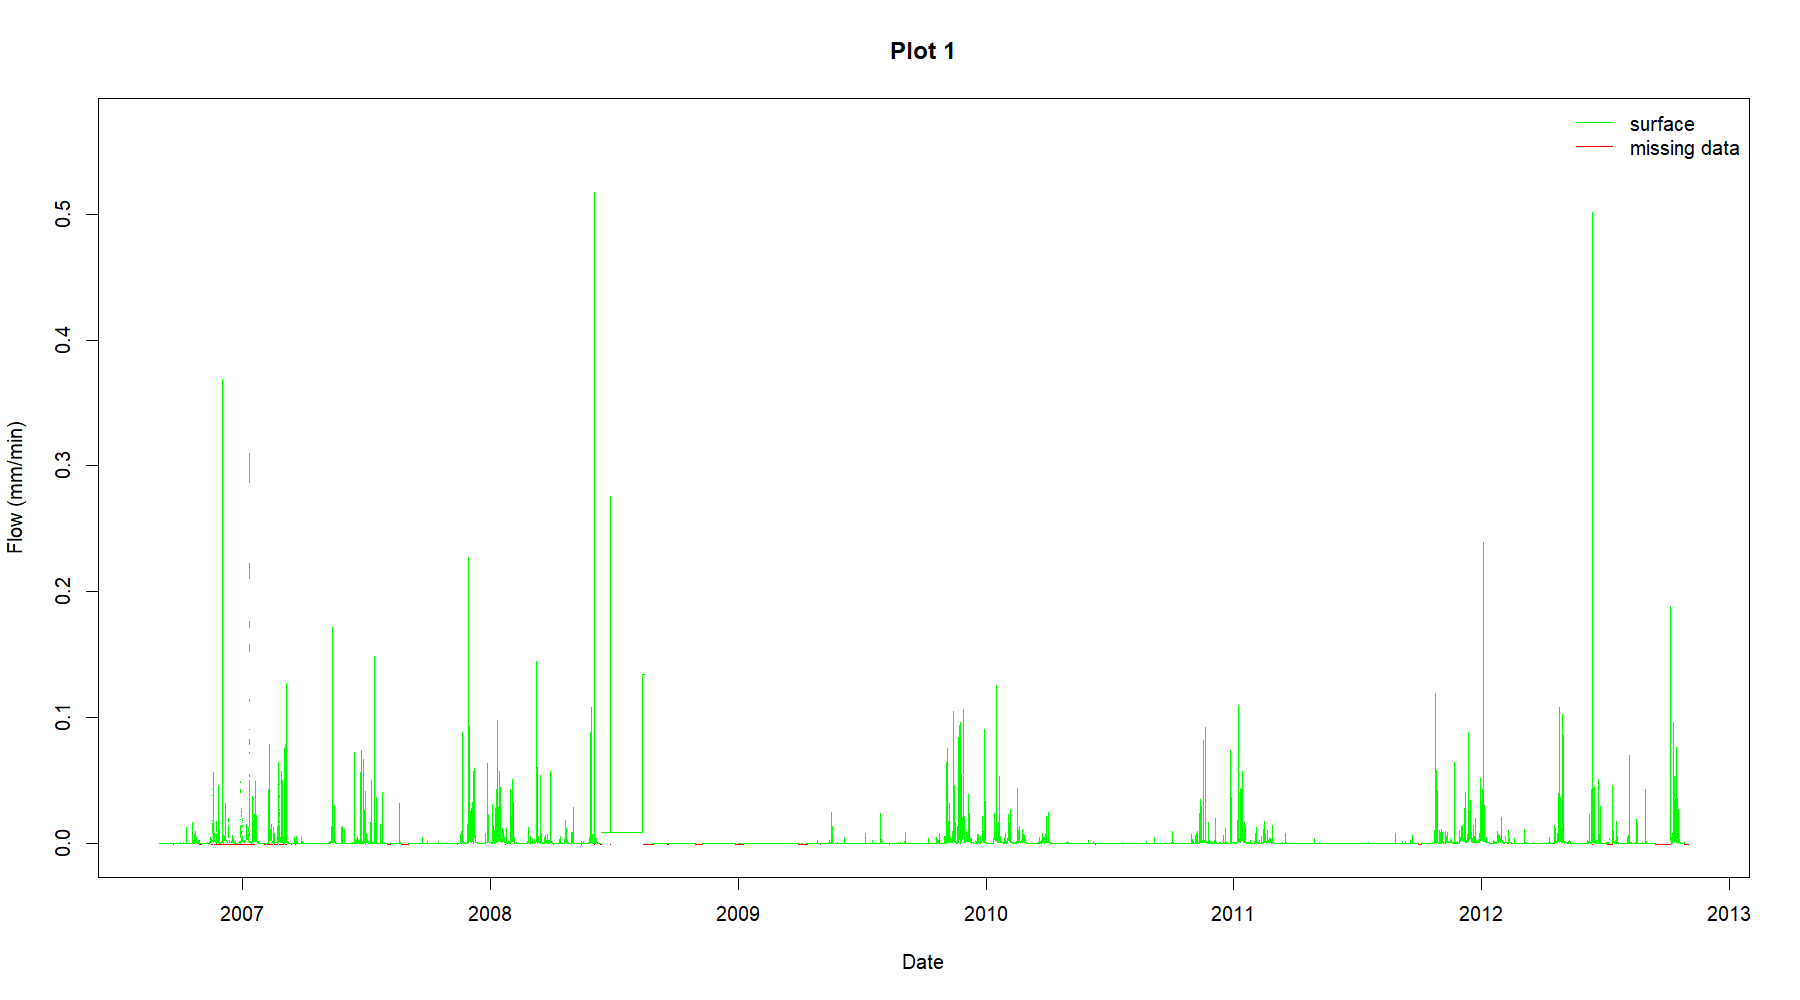
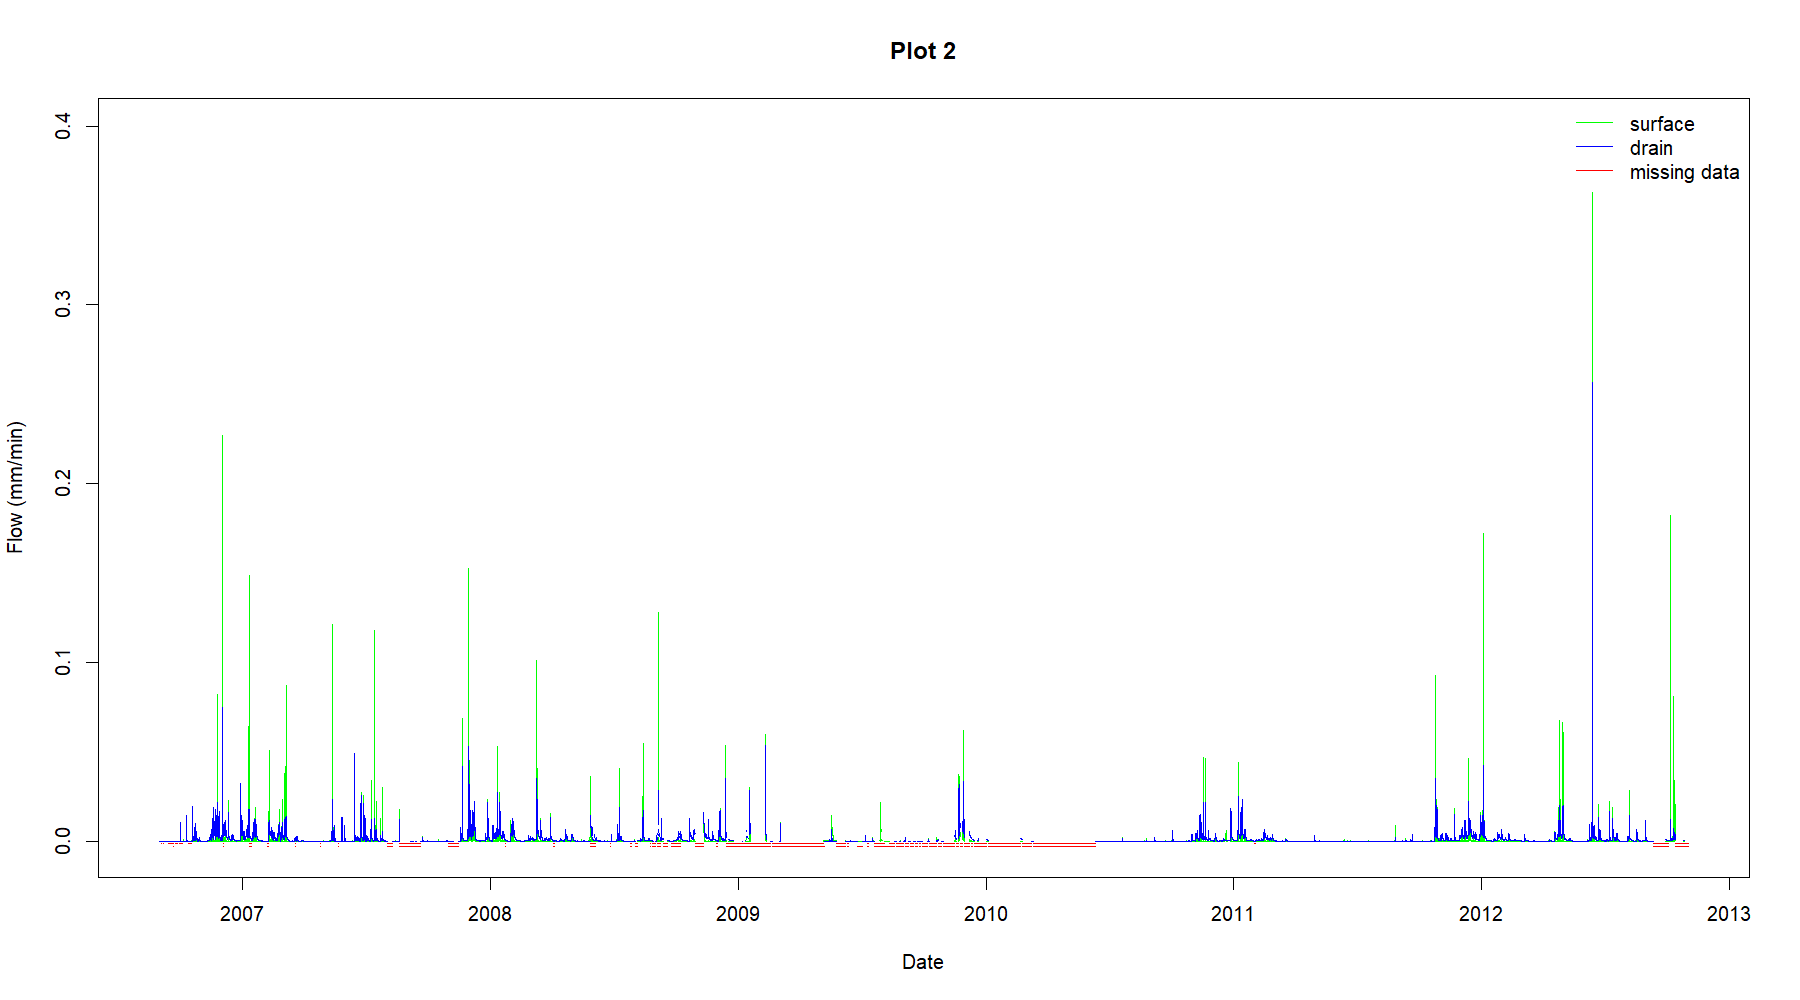
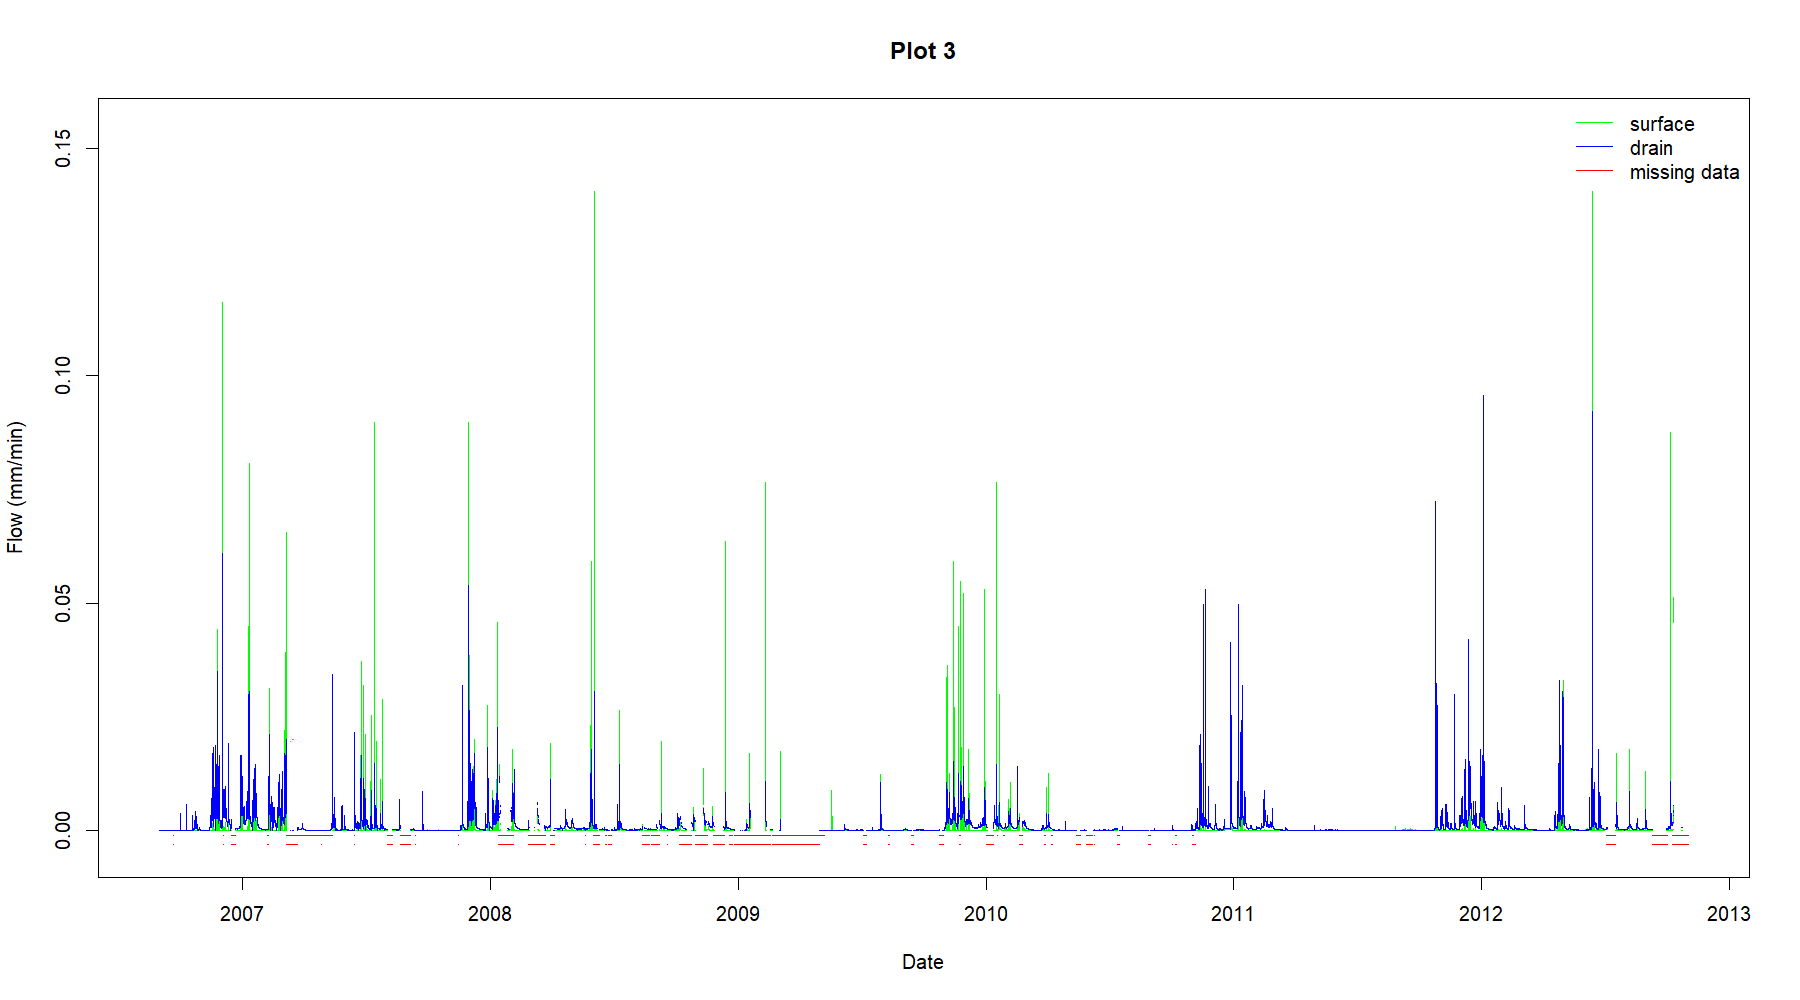
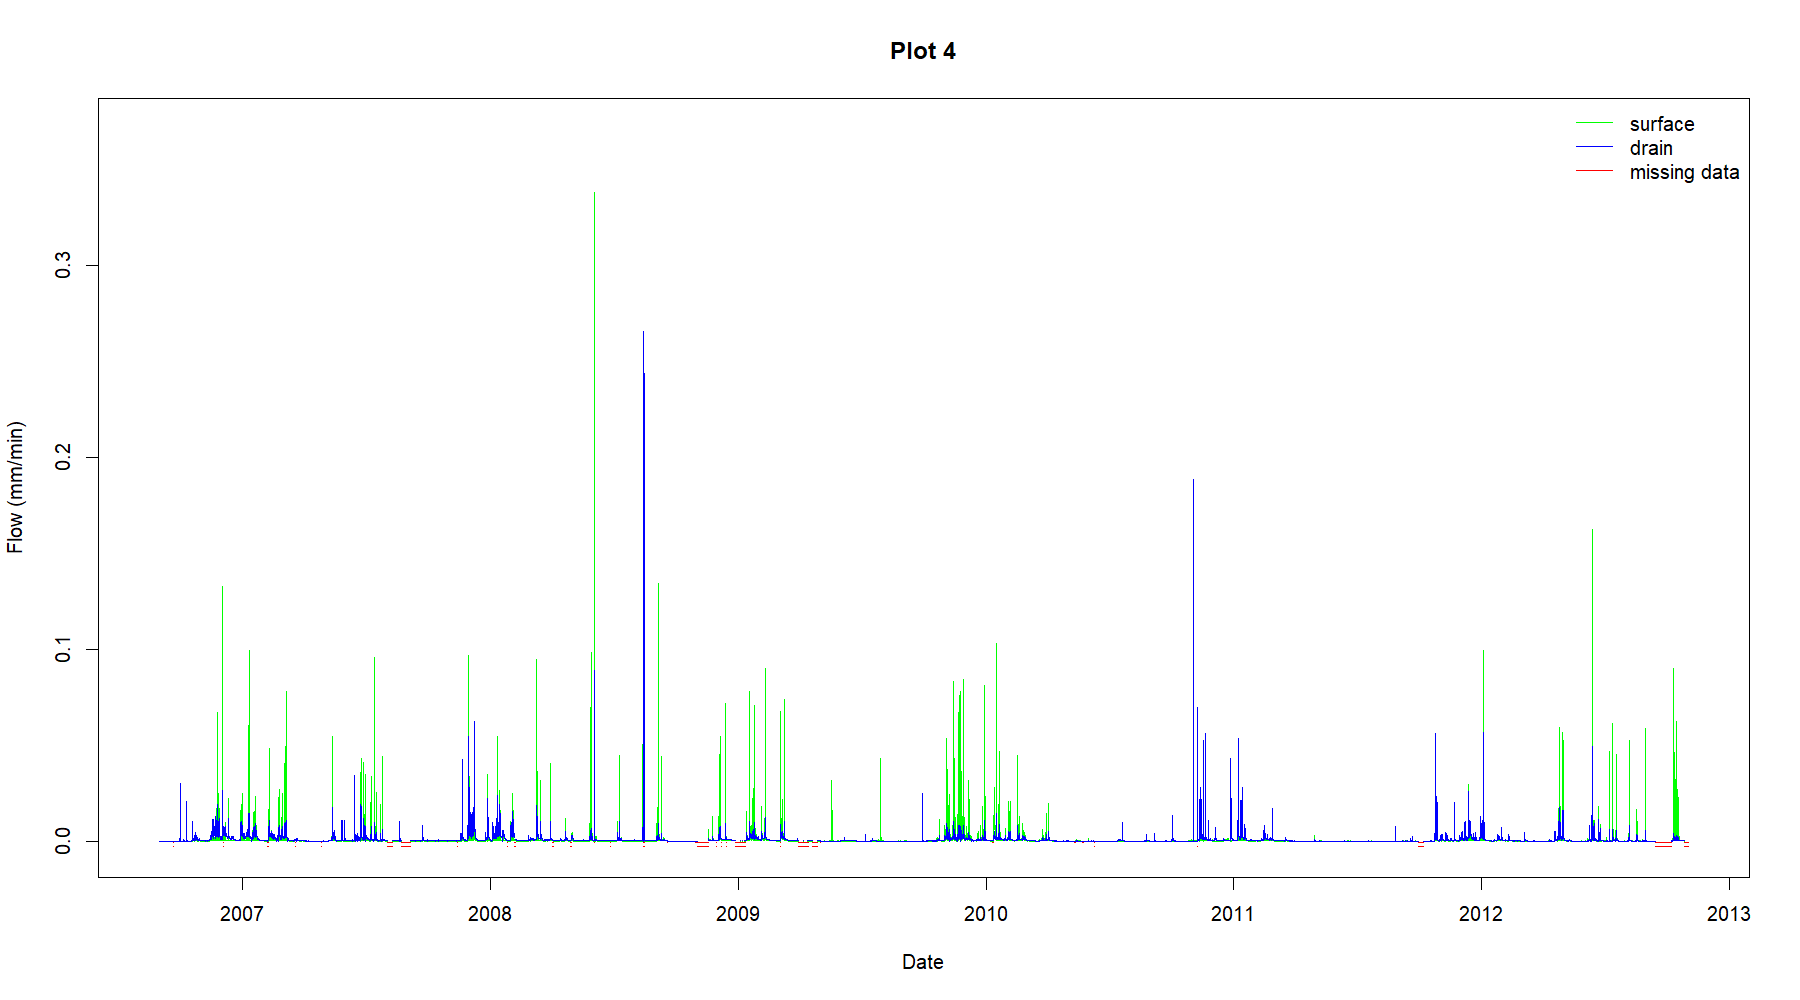
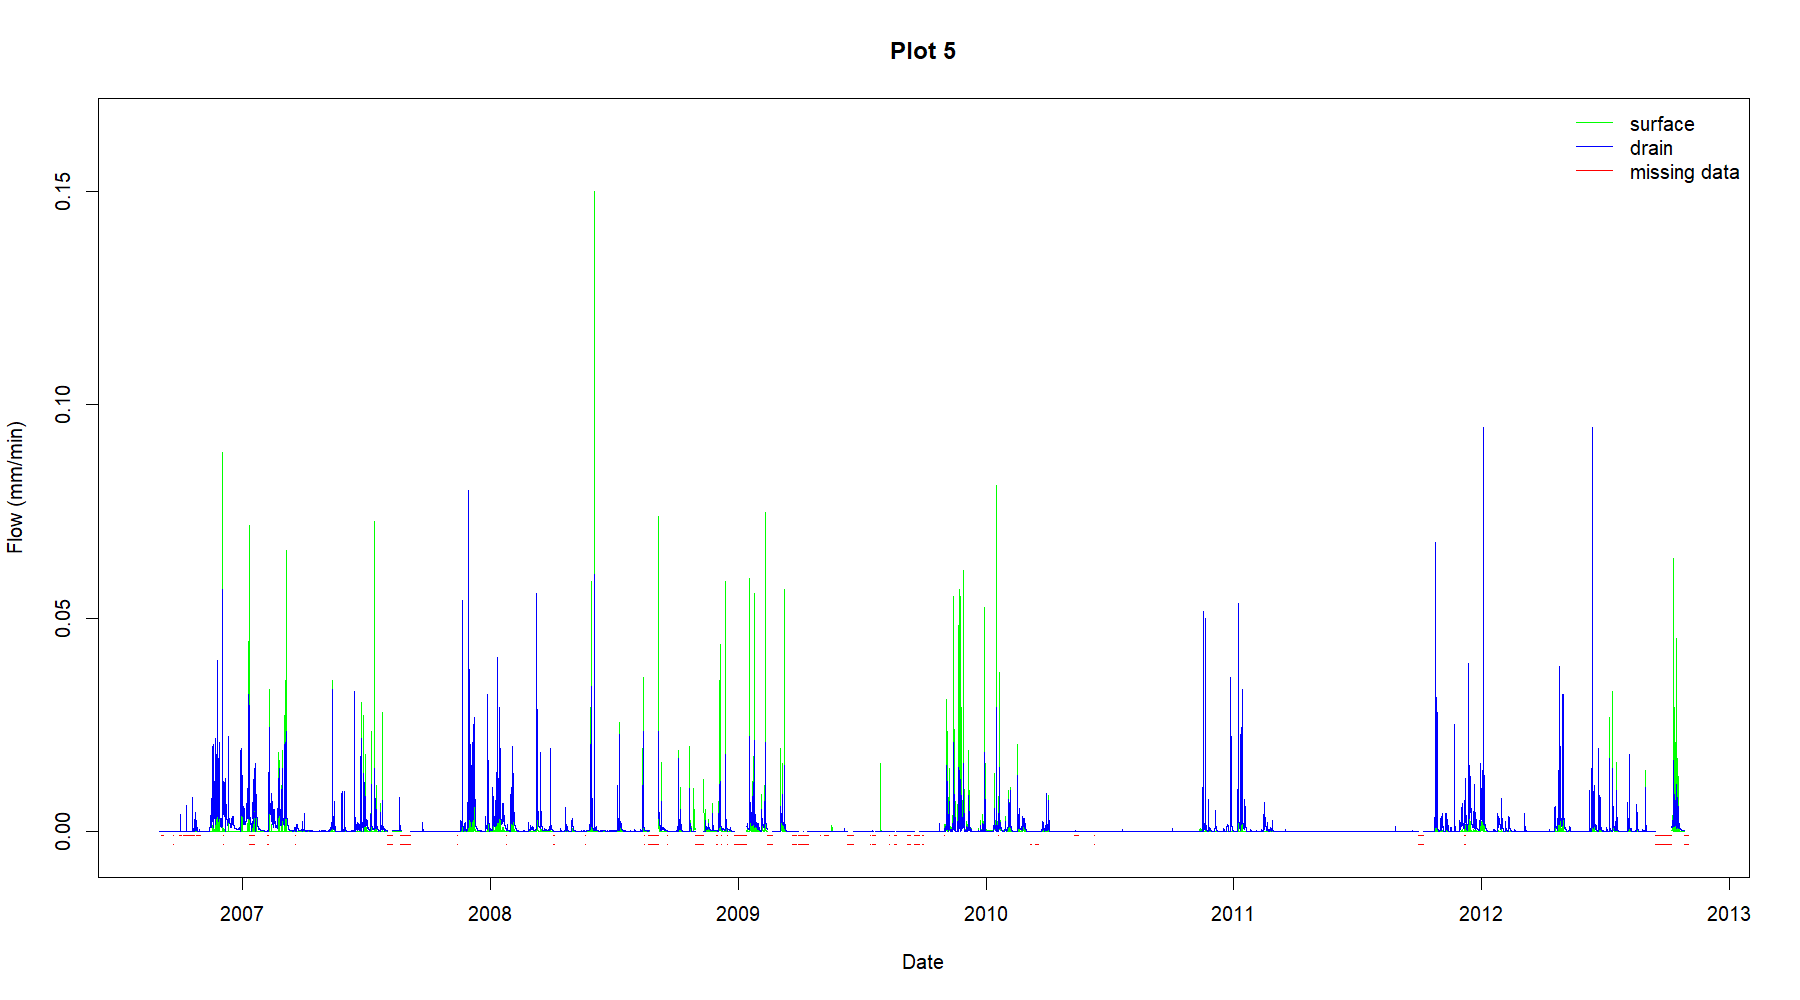
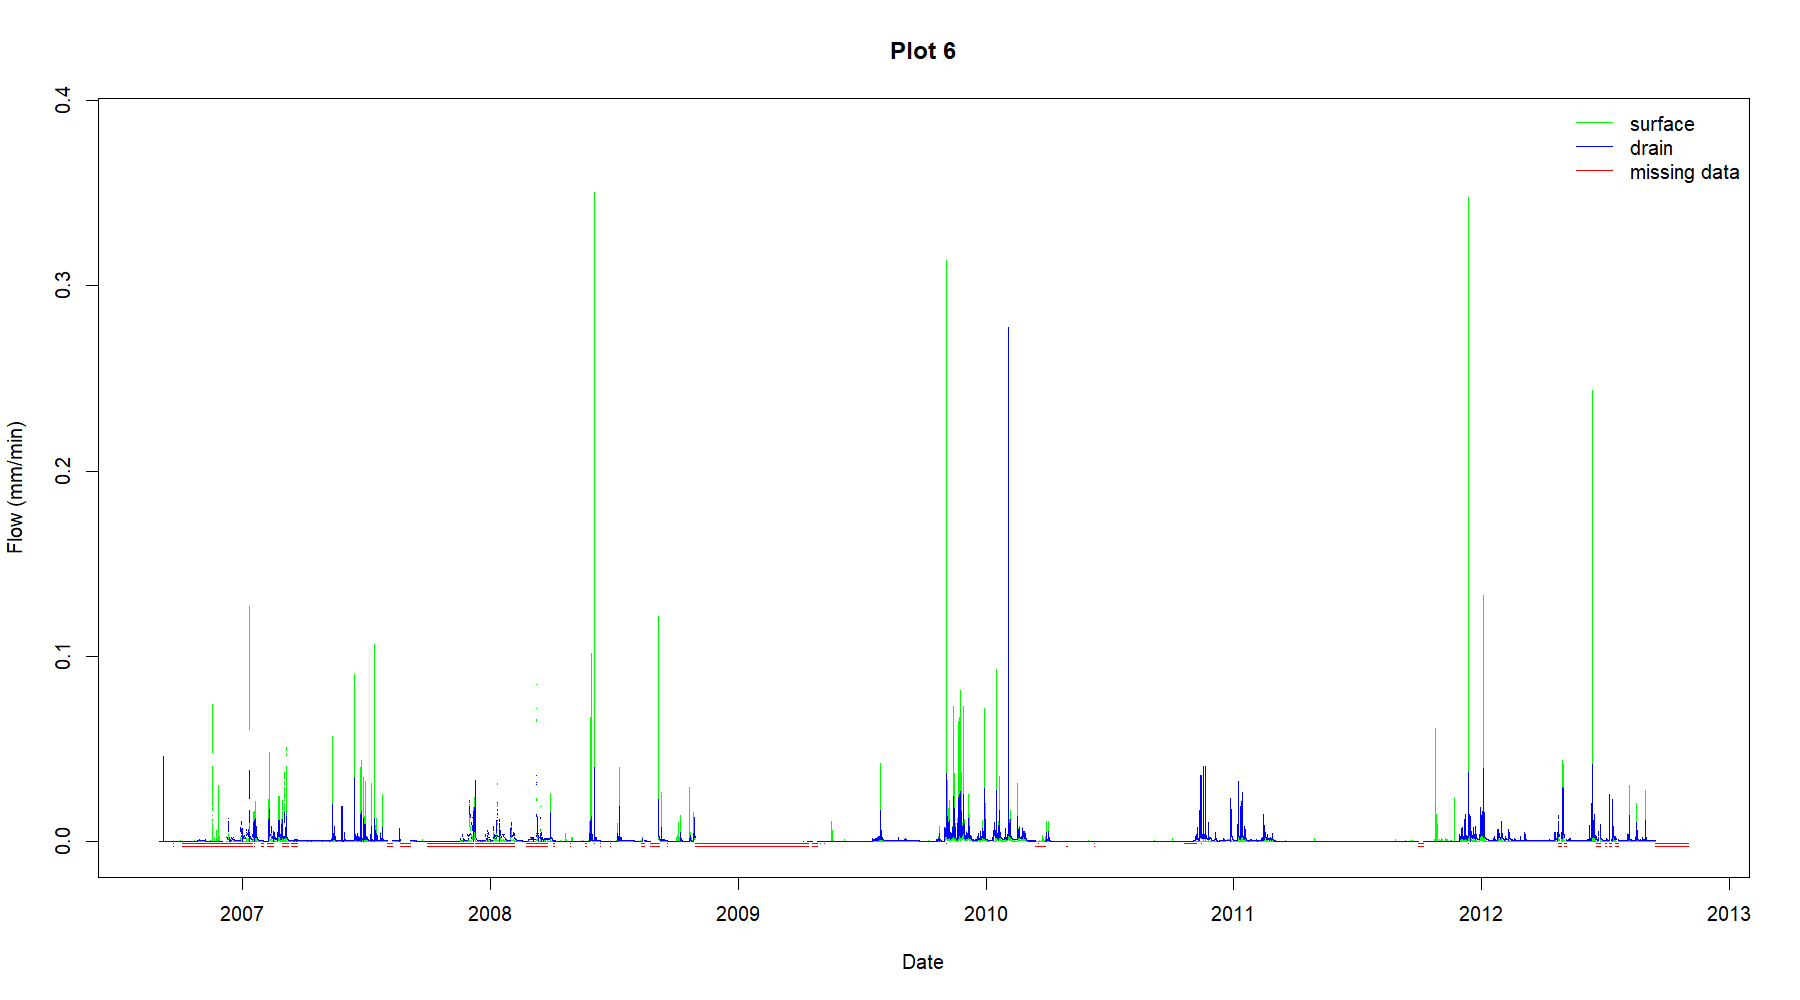
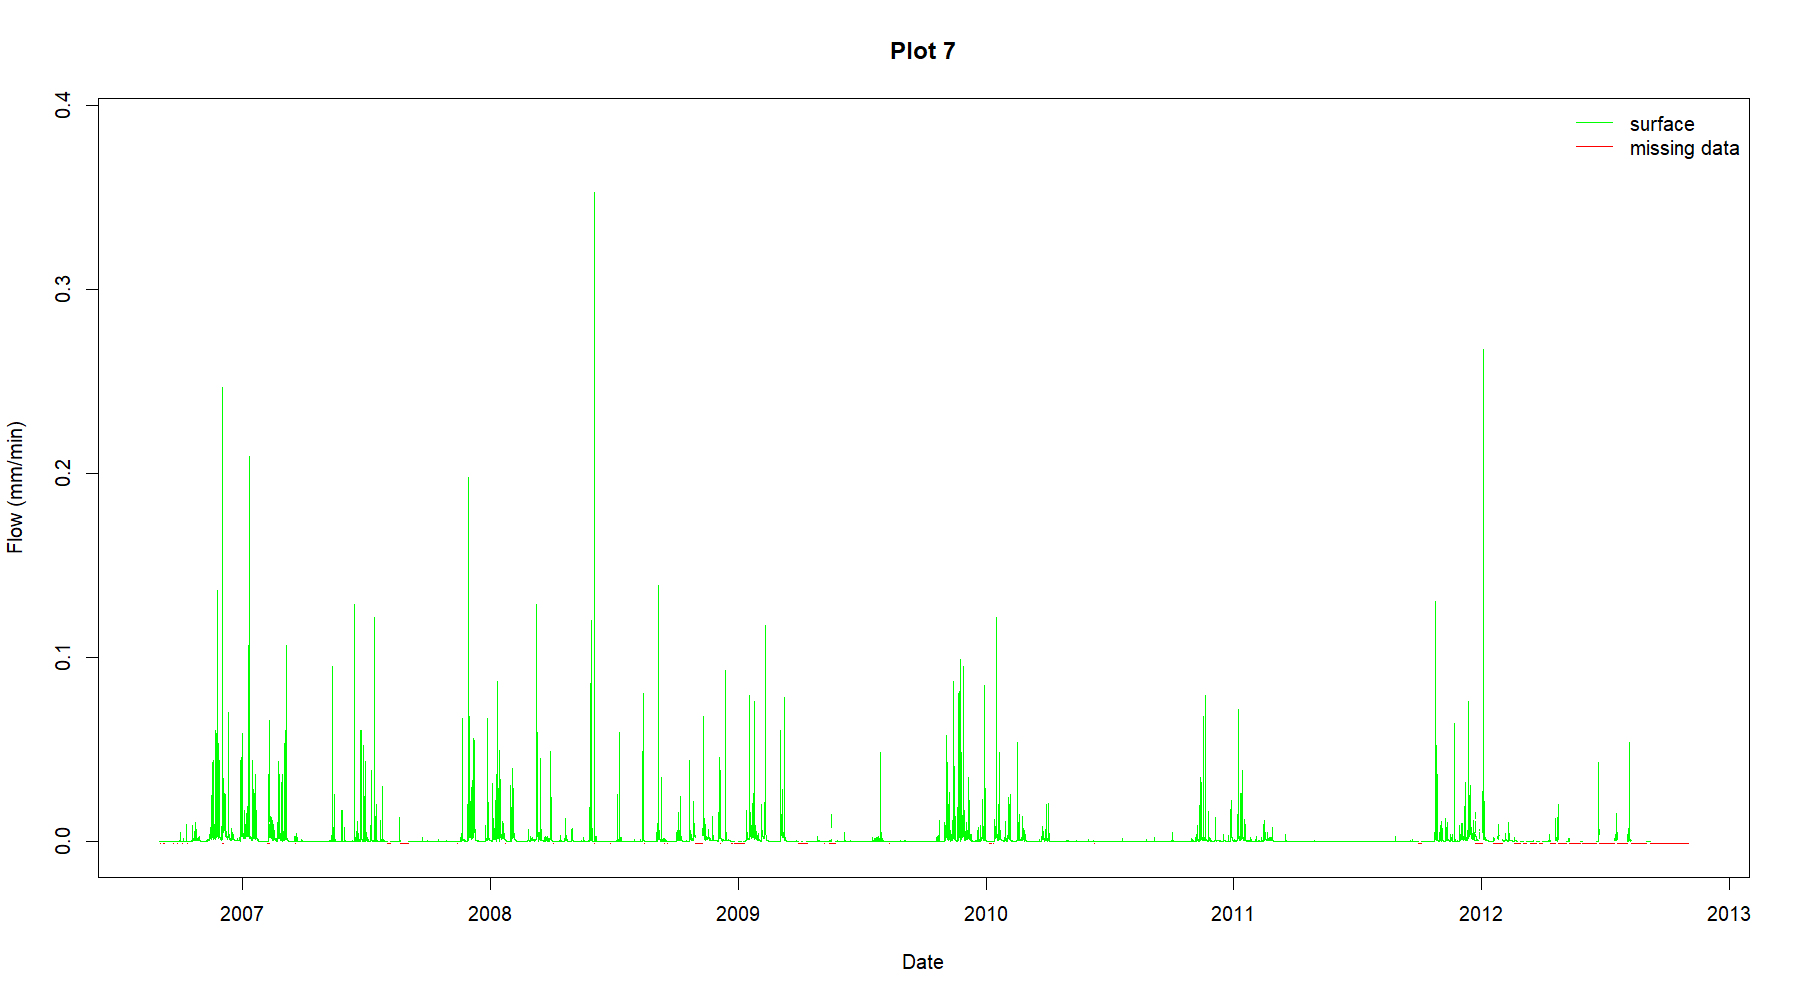
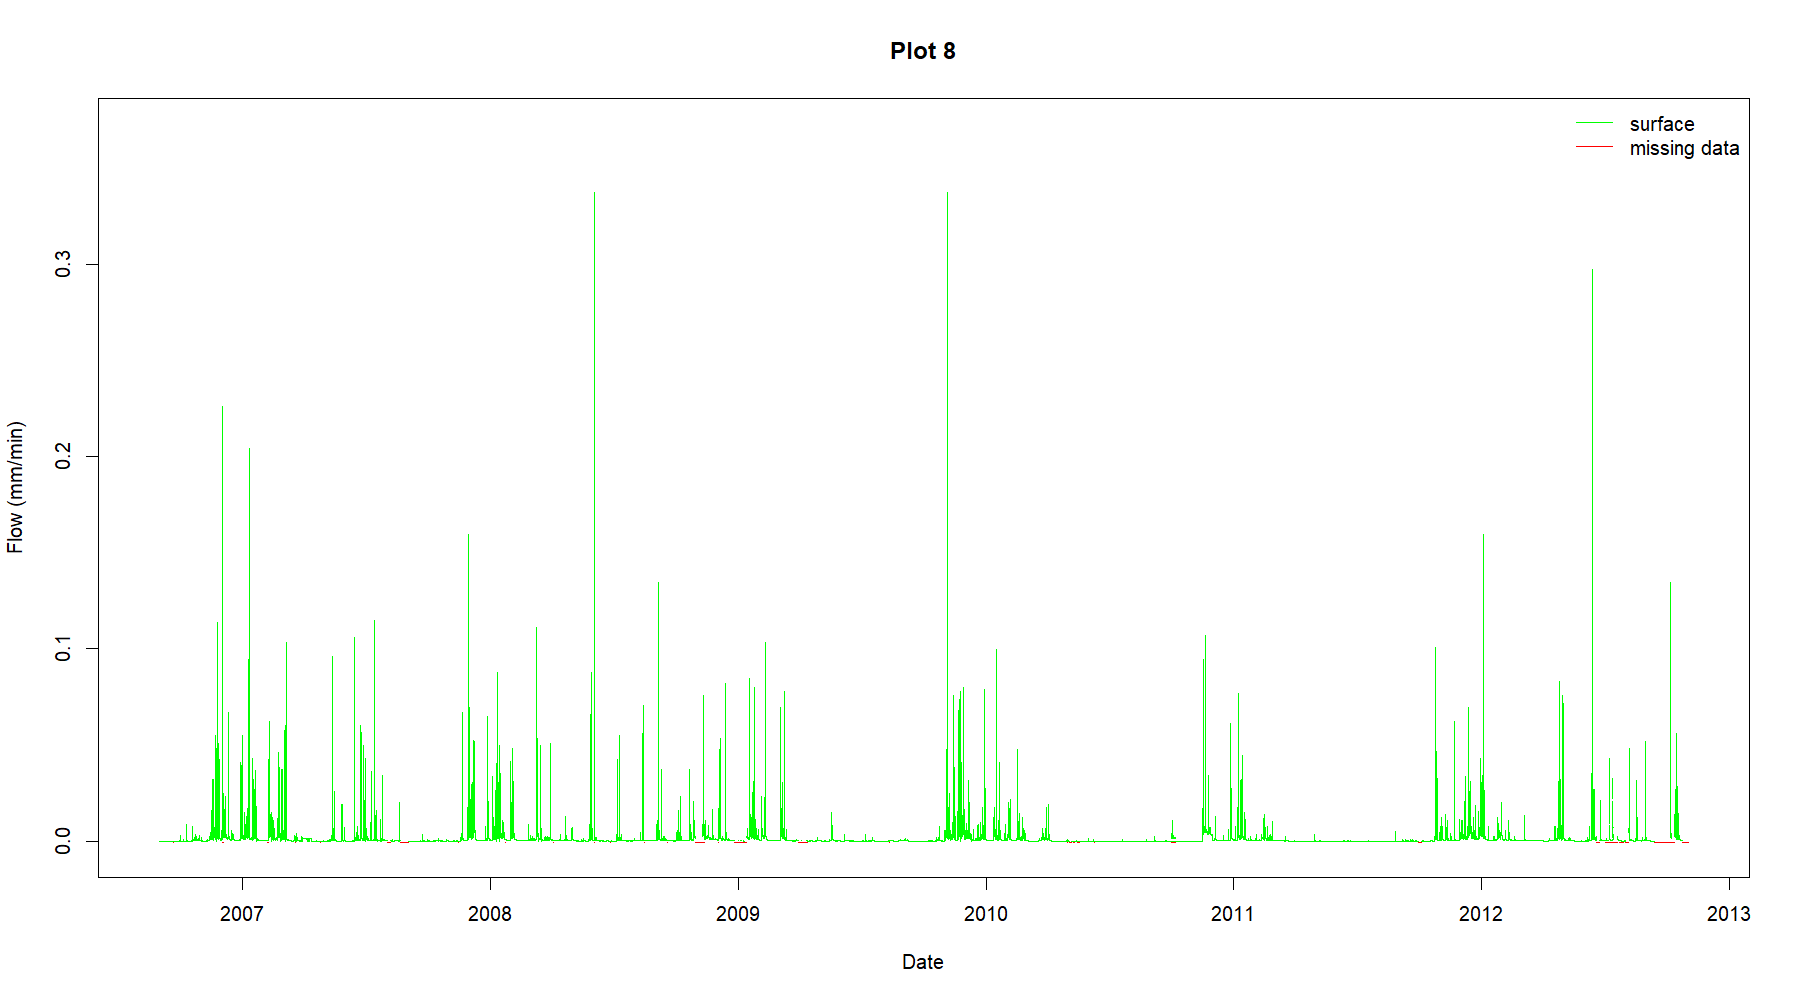
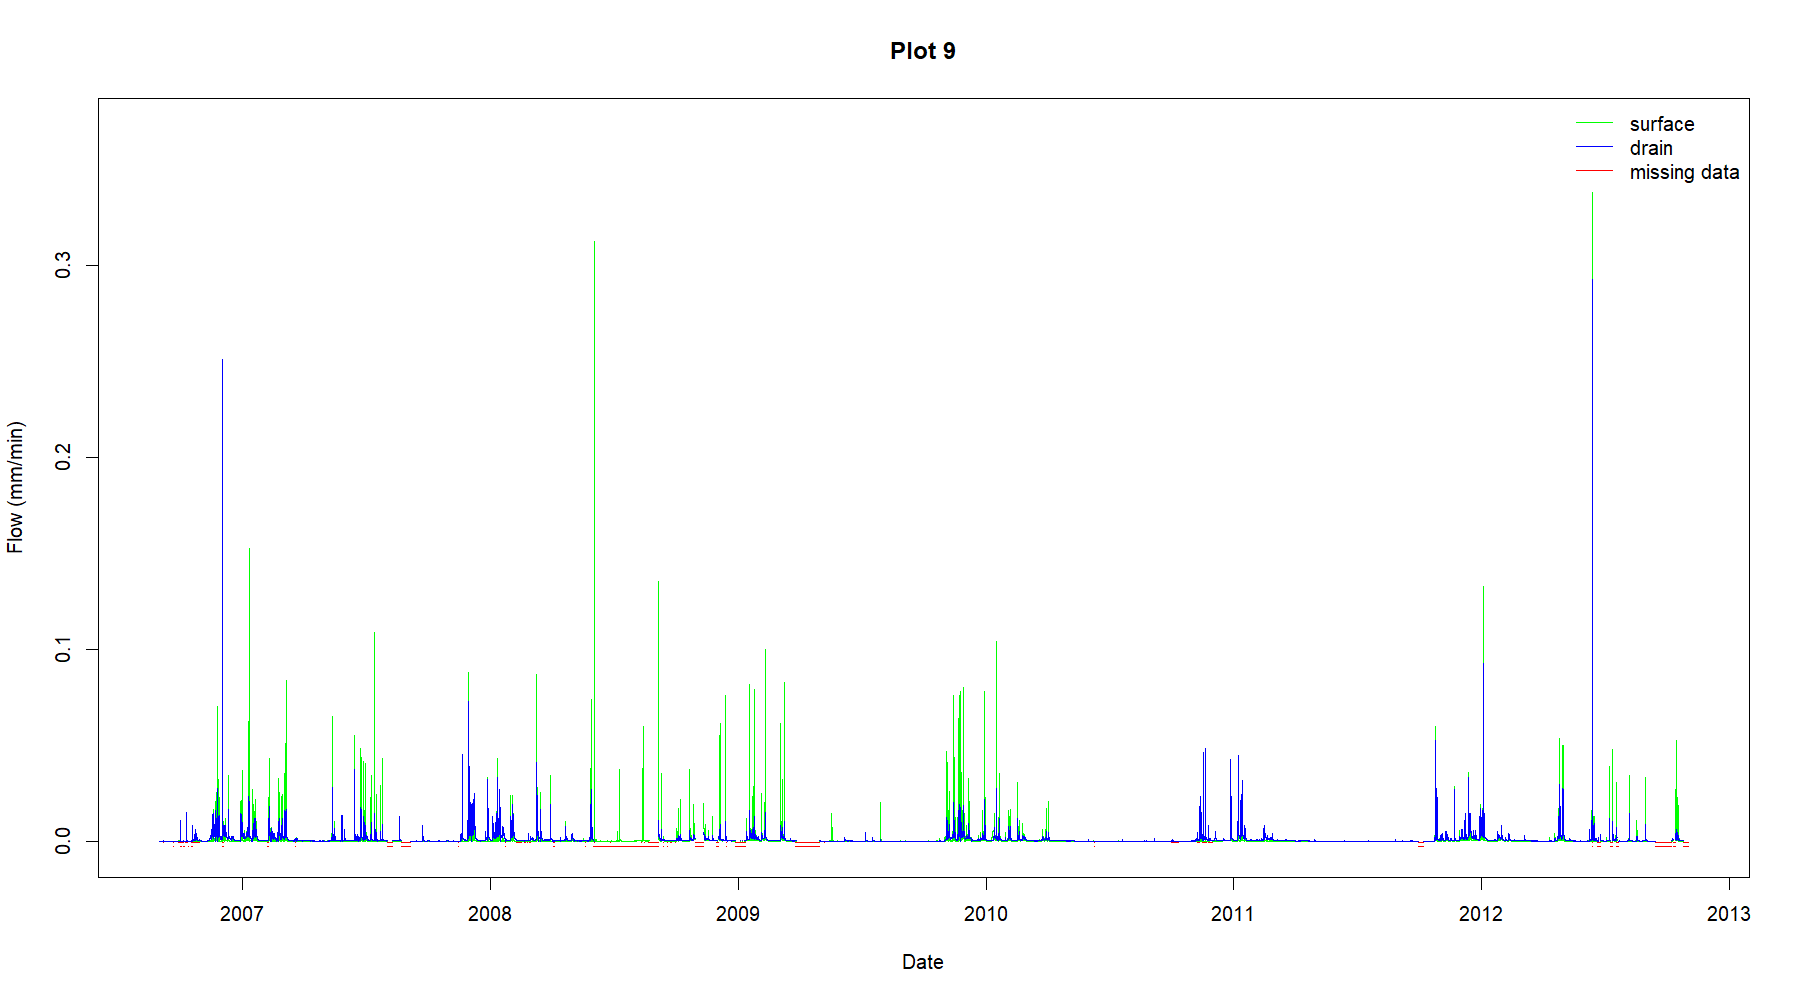
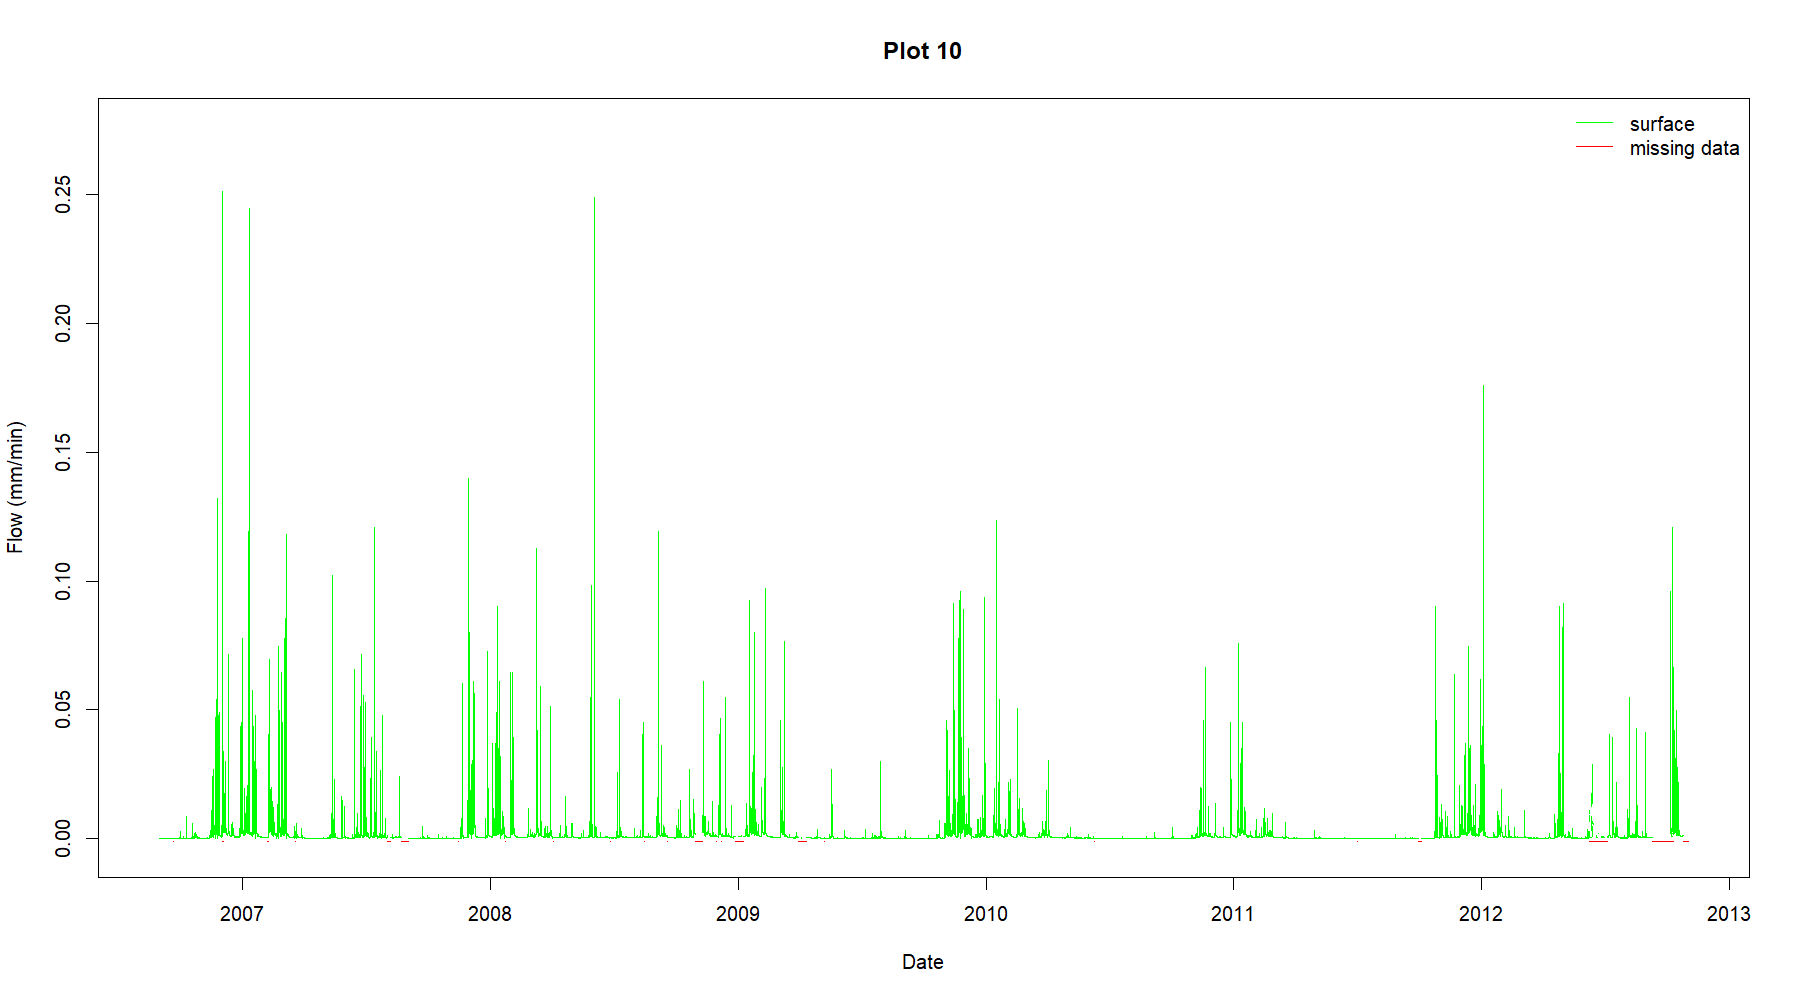
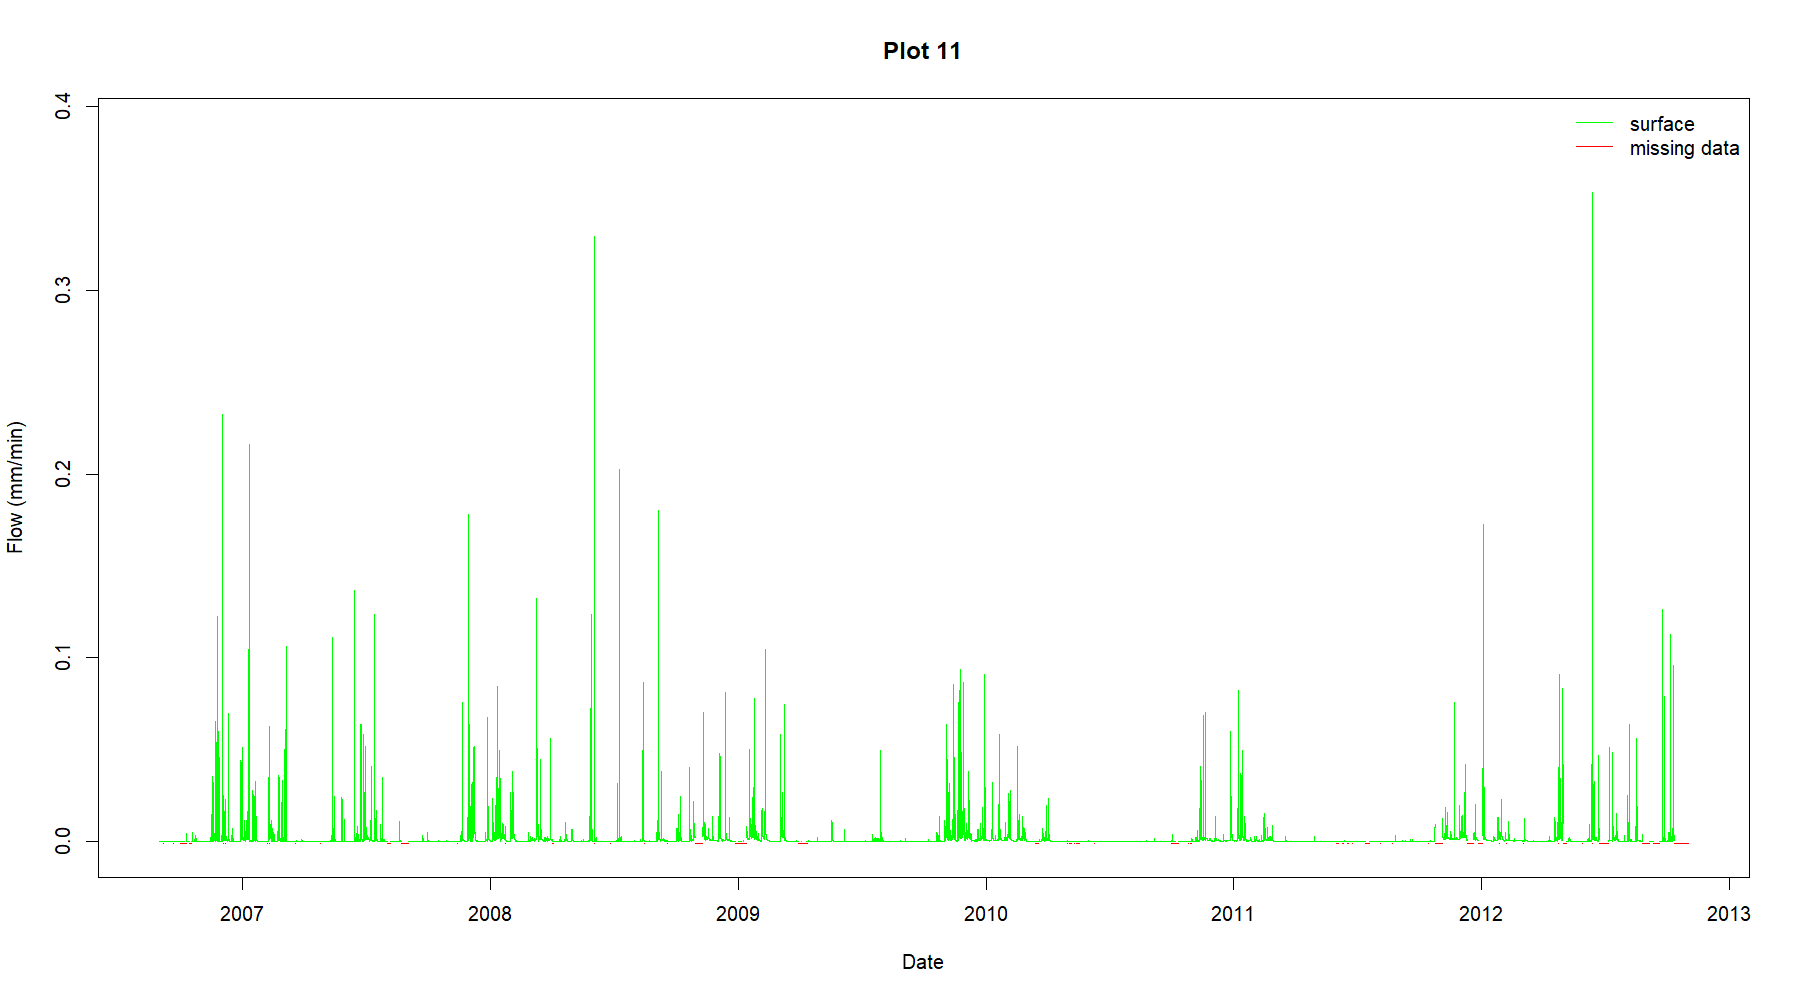
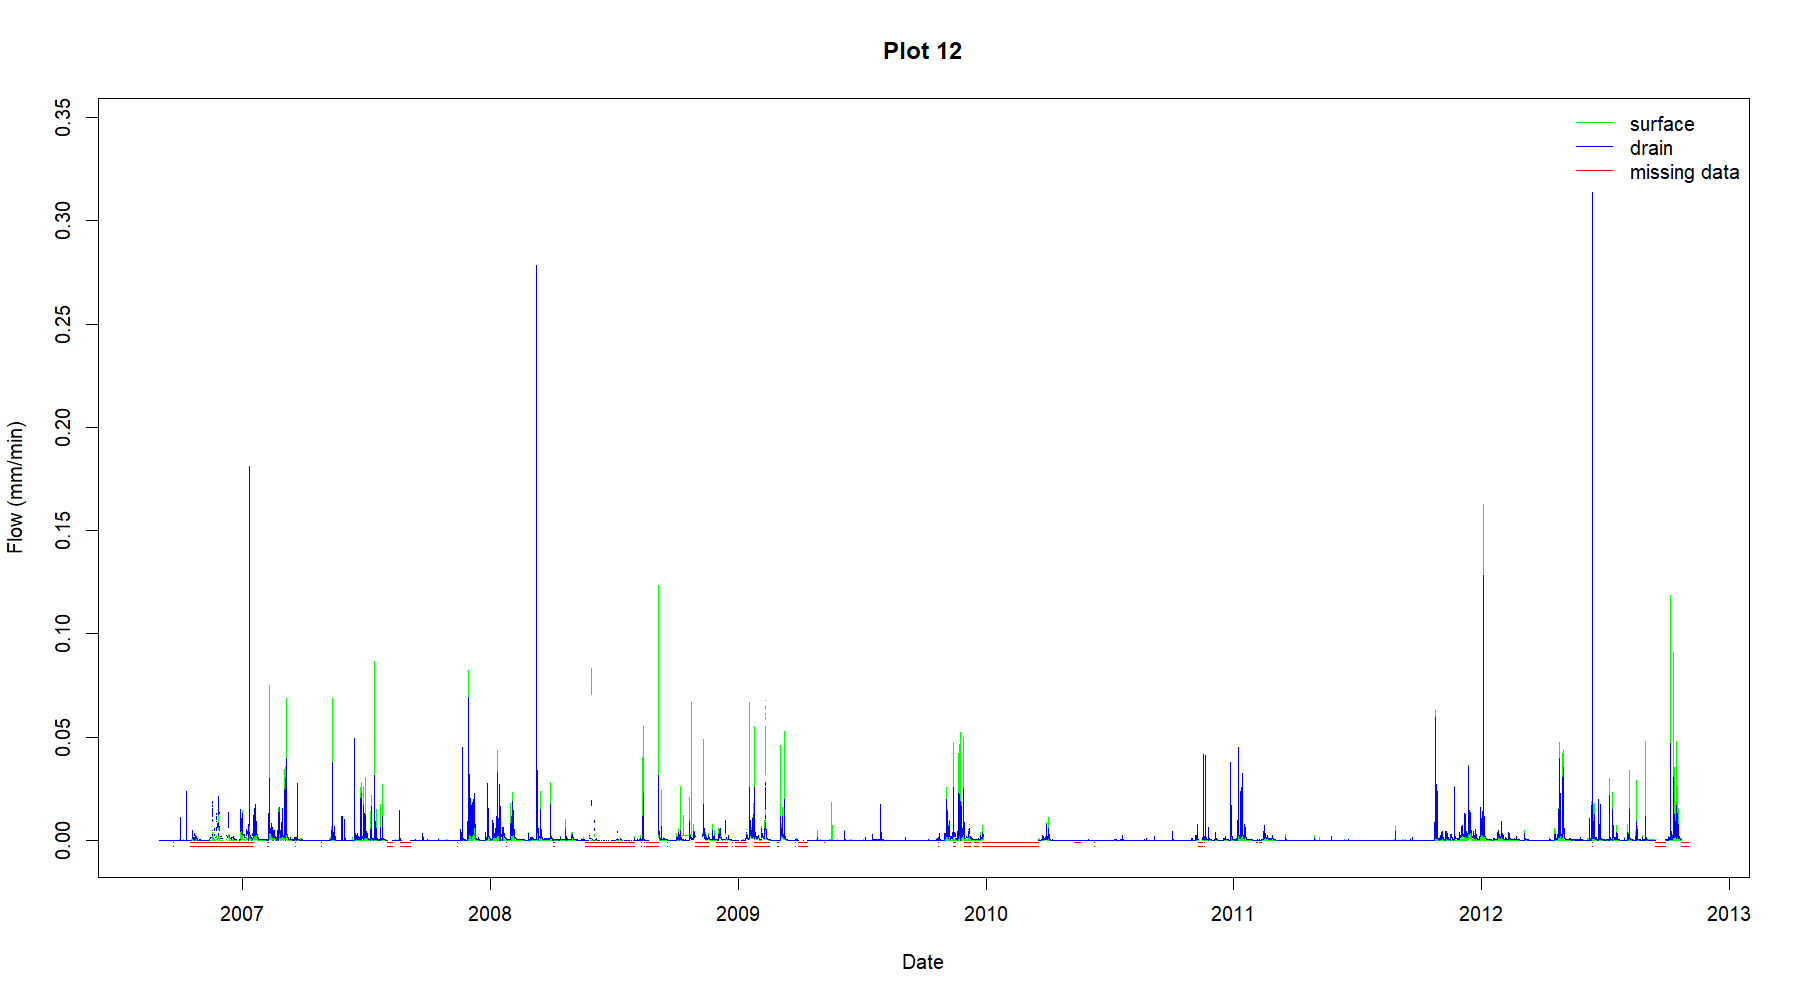
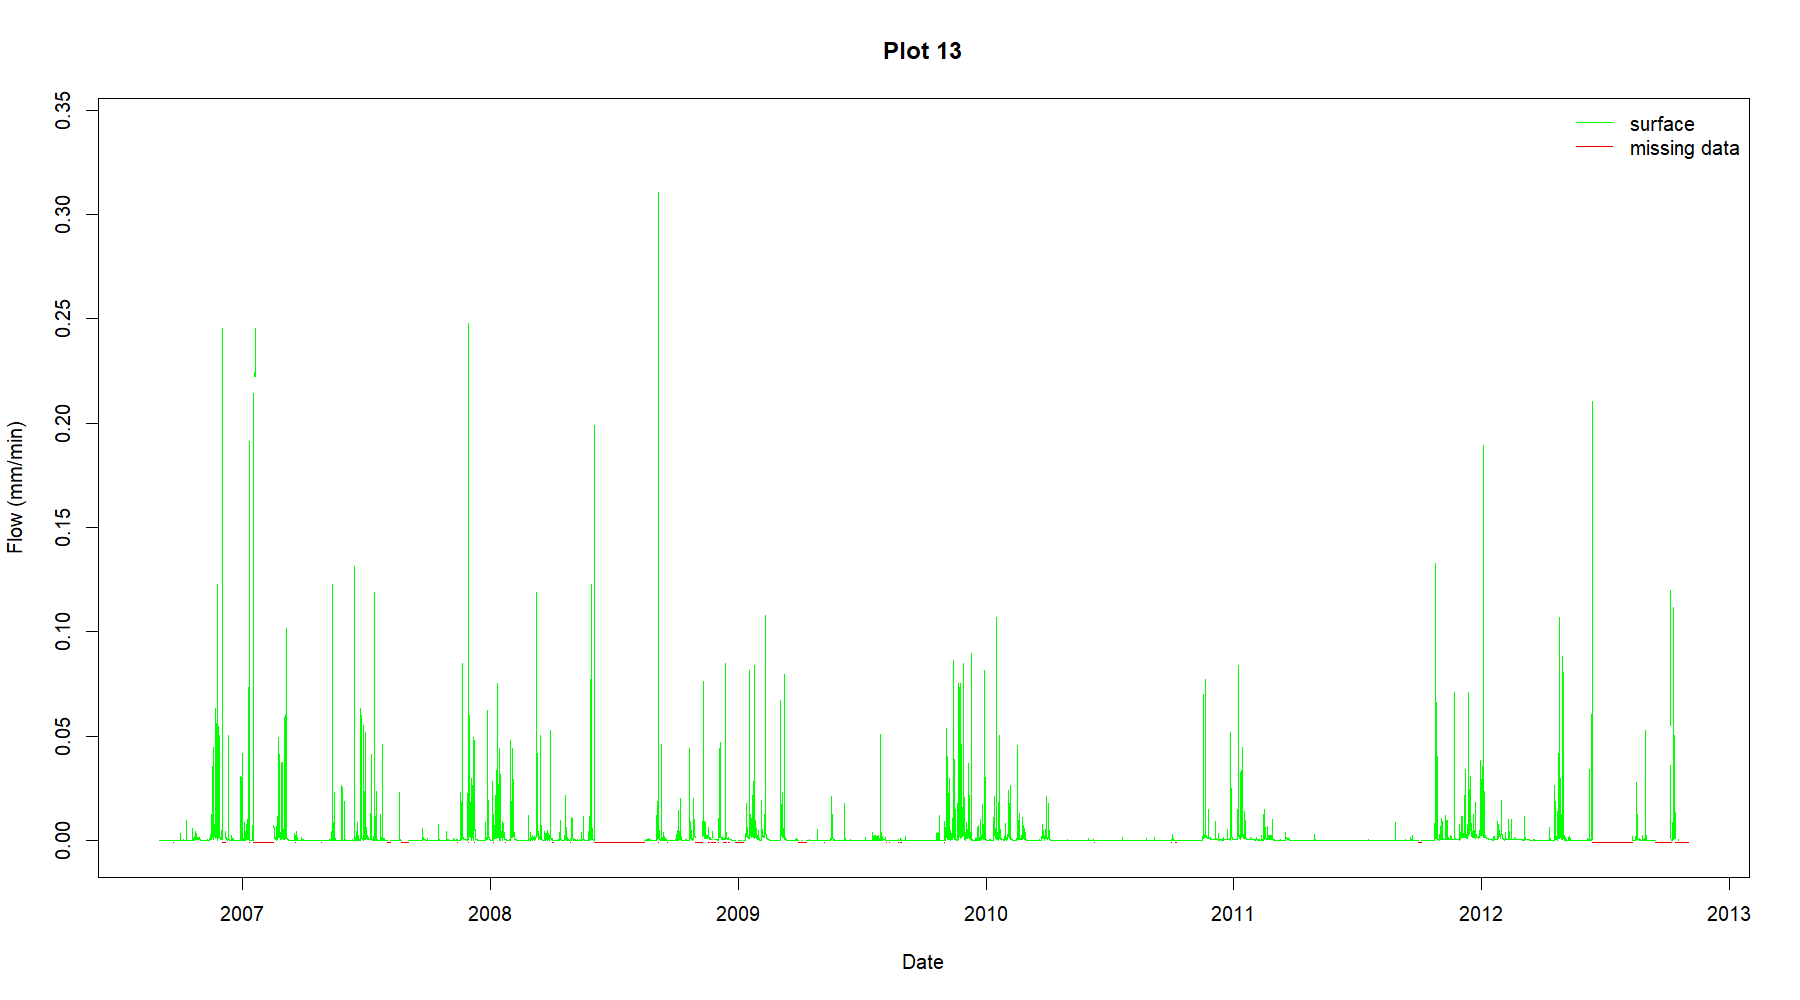
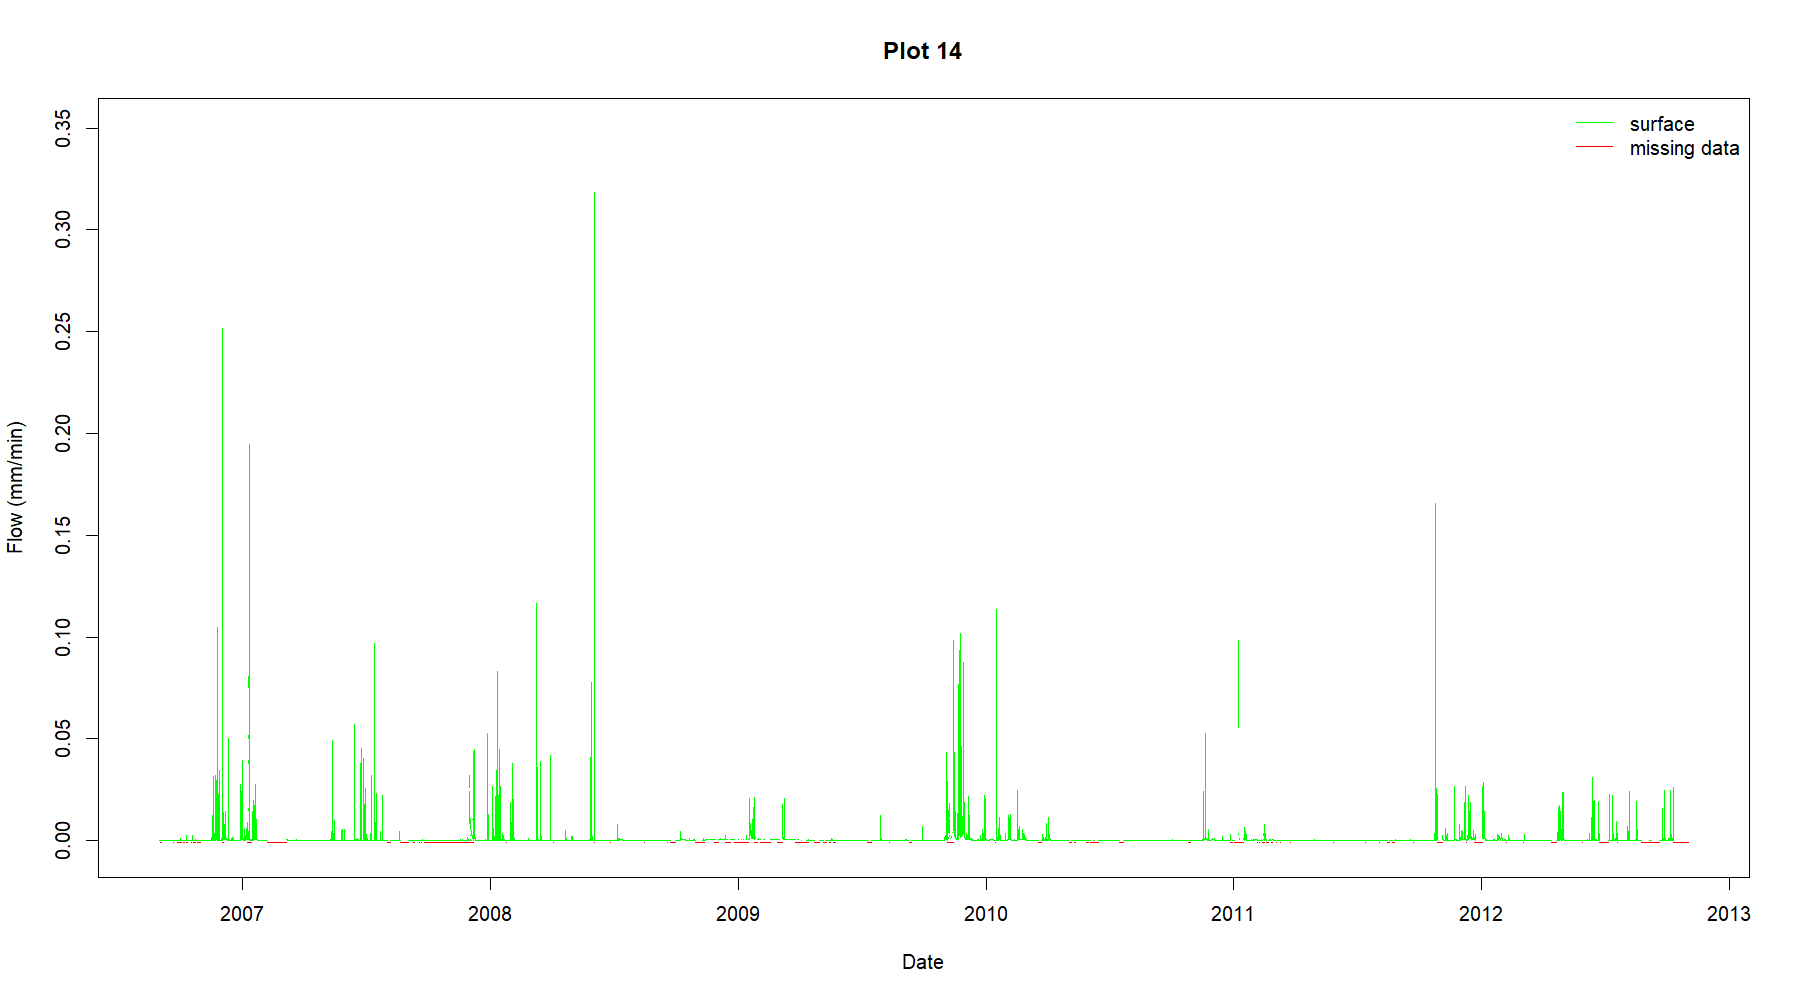
The hydrology dataset ‘RowdenHydrology.csv’ comprises hydrological discharge rates (mm / min) expressed as uncertainty envelopes (min and max uncertainty) for flow via surface/subsurface lateral and field drain pathways. The data were collected at 1-minute intervals from Sept 2006 to Oct 2012. Users should be aware that this .csv file is best opened from software such as R or python due to its size. Annual rainfall data collected at 60-minute intervals by two different instruments and spanning the period Sept 2006 - Dec 2012 are also included in ‘RowdenRain.csv’. Column units and descriptions are given in the metadata file, ‘Column_units_and_descriptors.csv’.

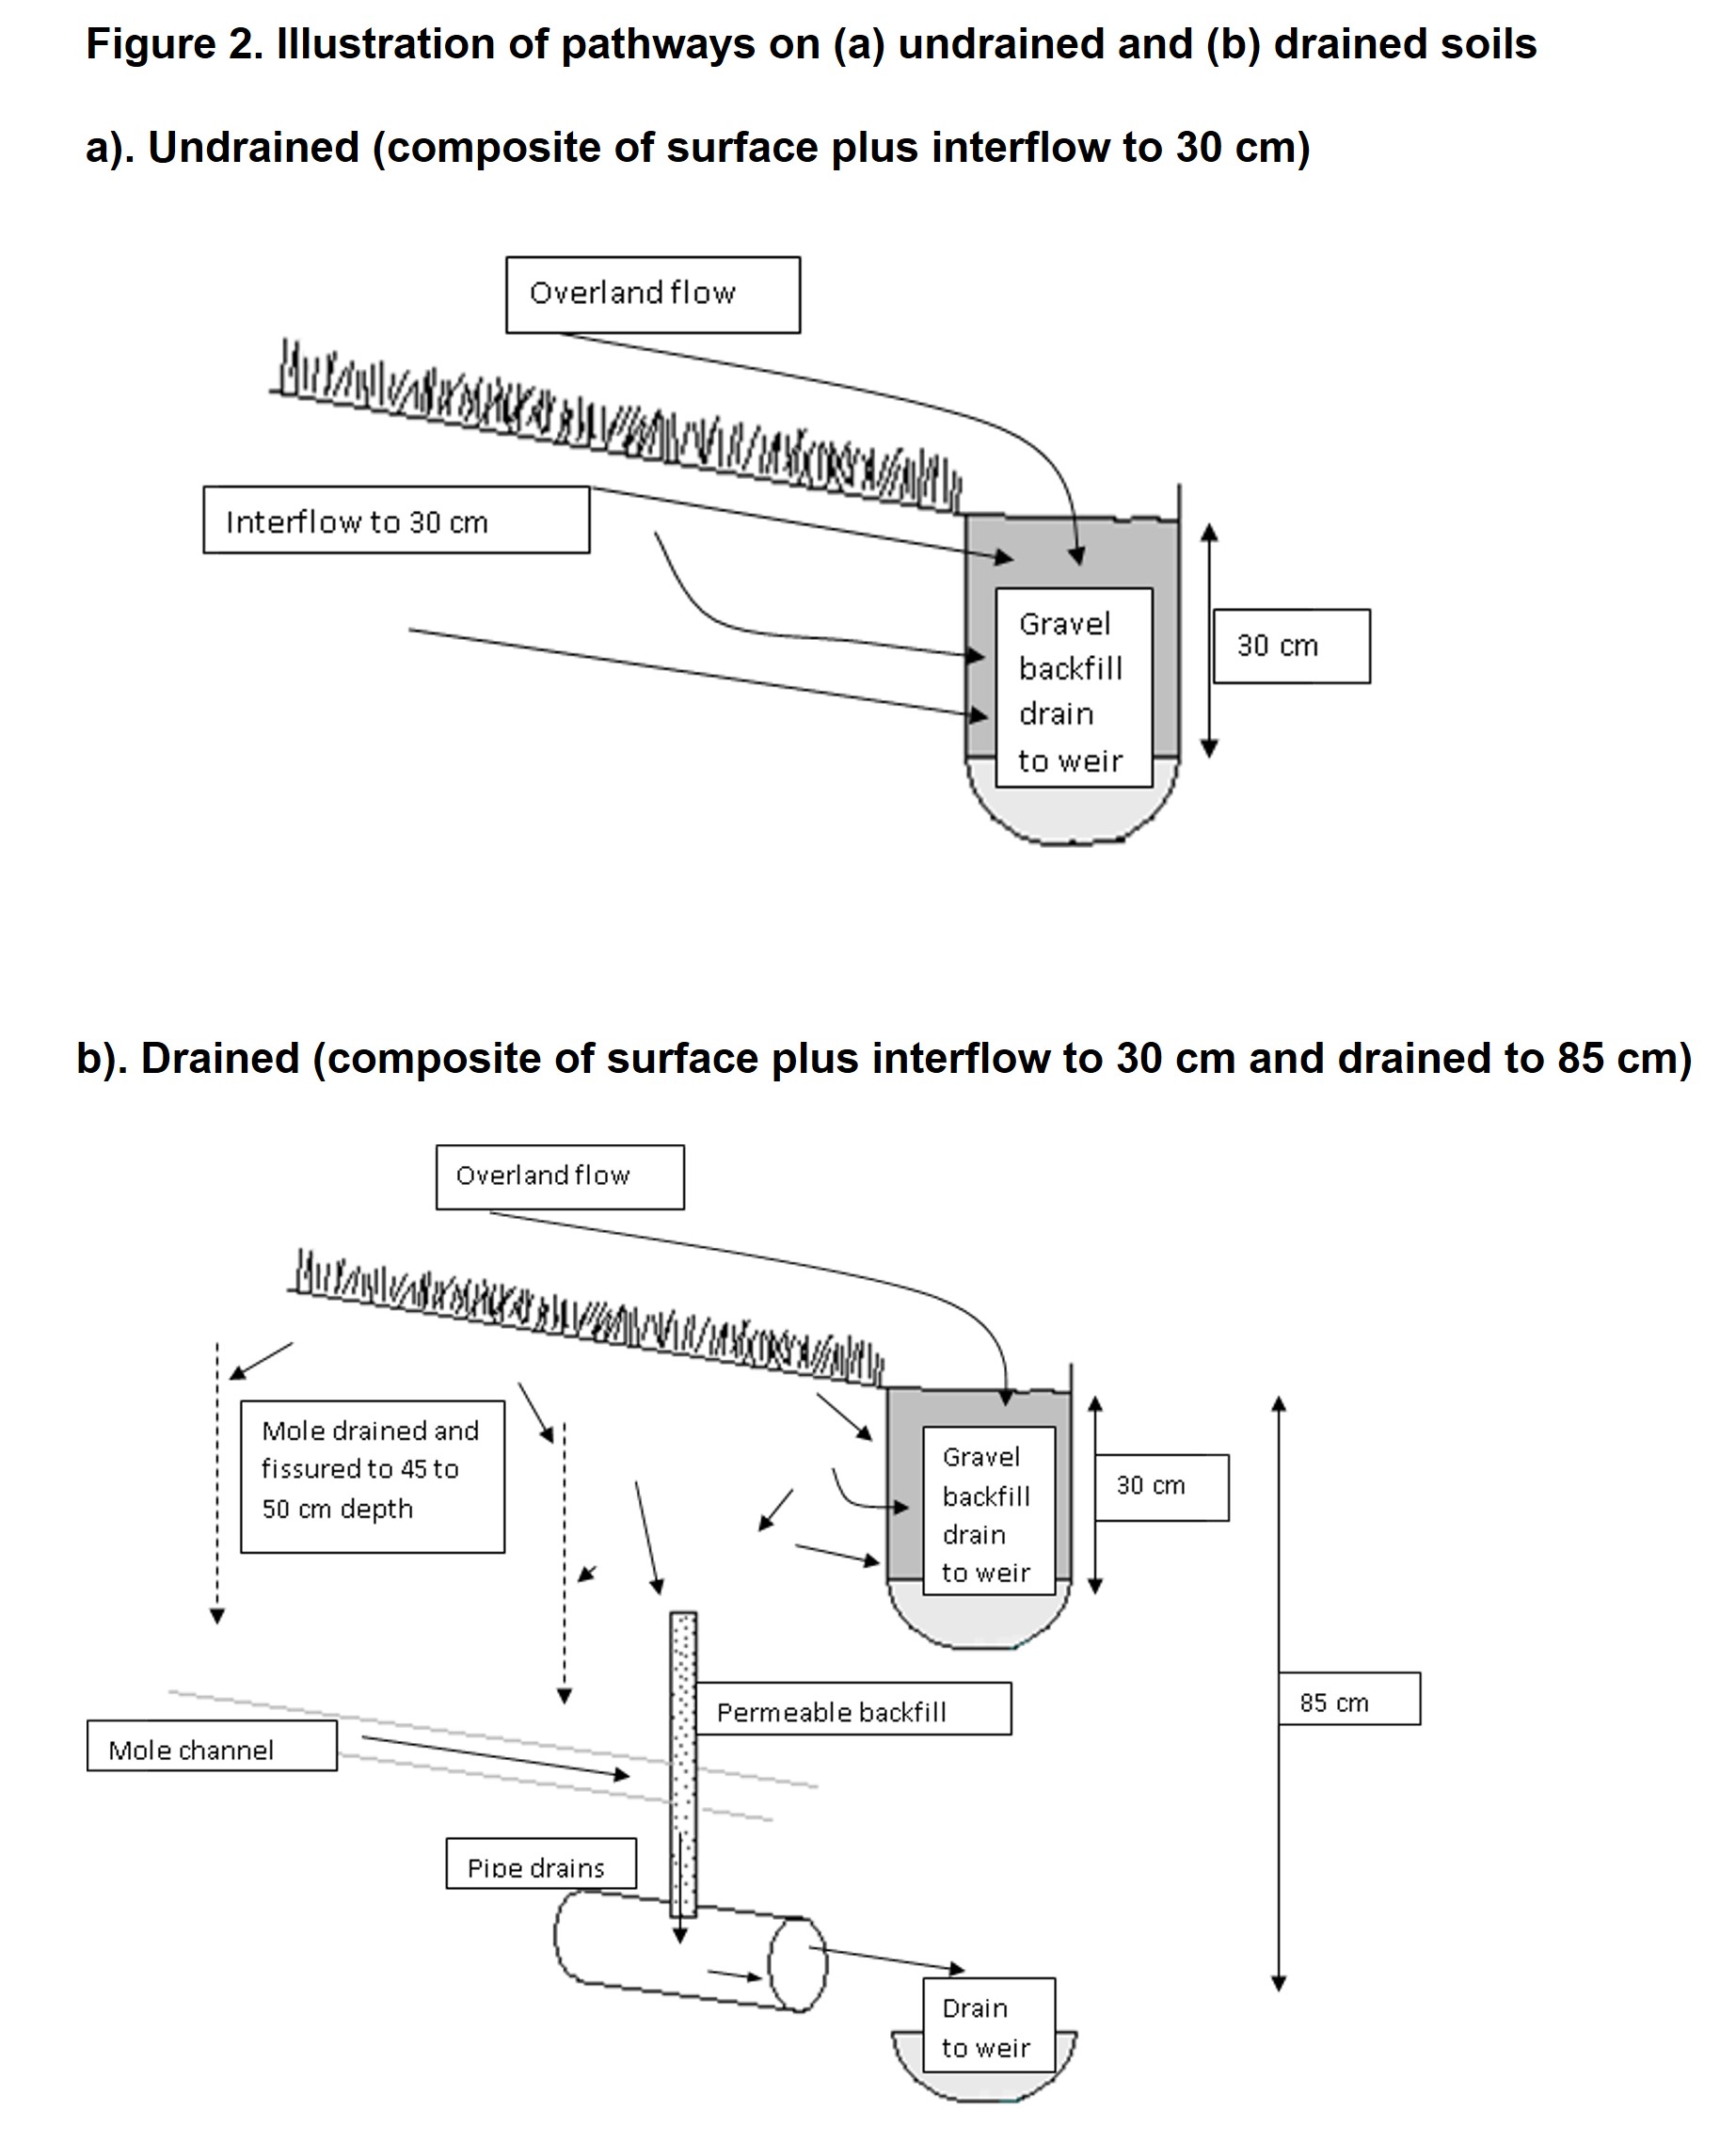
'Fig1.jpg' is a map showing the site layout of the Rowden Drainage Experiment, and 'Fig2.jpg' is an illustration of the collection pathways on the undrained and drained plots. In addition, graphs (.png files) of the mean of the uncertainty envelope values for each plot are included as a visual guide to the data and help illustrate where there are missing data. In these, red lines indicate areas of missing data. For drained plots, the top line represents quality of the surface lateral runoff data, and the bottom line the quality of the drainage data.

Year of Publication2023
PublisherRothamsted Research
Digital Object Identifier (DOI)https://doi.org/10.23637/rothamsted.98y67
Keywordshydrology
rainfall patterns
runoff water
subsurface runoff
mole drainage
tile drainage
pastures
lysimeters
long term experiments
clay soils
Publication dates
Online24 Oct 2023
Related Output
Documentshttps://doi.org/10.1111/j.1753-318X.2012.01156.x
Is described byhttps://doi.org/10.1002/hyp.3360050204
Data files
Copyright license
CC BY 4.0
Data type
Spreadsheet
Contents
Data
File Access Level
Open
Data files
Copyright license
CC BY 4.0
Data type
Image
Contents
Additional metadata
File Access Level
Open
Data files
Copyright license
CC BY 4.0
Data type
Image
Contents
Additional metadata
File Access Level
Open
Data files
Copyright license
CC BY 4.0
Data type
Spreadsheet
Contents
Documentation
File Access Level
Open
Data files
Copyright license
CC BY 4.0
Data type
Text
Contents
Documentation
File Access Level
Open
Data collection period01 Sep 2006 to end of 31 Dec 2012
Geographic location
North Wyke Research, South West England, UK
Geographic region bounding box
(50.7792, -3.9156) to (, )
Data collection method

Site Description

The Rowden Drainage Experiment site is located in the south-west of England (3° 54’ W, 50° 46’ N; -3.9156, 50.7792) on the Rothamsted Research, North Wyke farm. The site is 180 m above sea level and the mean annual rainfall over a 40-year period (1981 to 2020) for this area is 1048 mm.

The experiment was established in 1982 on old unimproved pasture on poorly drained land that slopes (5-10%) from west to east. The soil has been classified as a clayey non-calcareous pelo-stagnogley (Avery, 1980) of the Hallsworth series and is representative of much of the permanent pastureland in the UK (Boorman et al., 1995). Under the USDA system of soil taxonomy, the soil is classed as a typic haplaquept (USDA-SCS, 1975). The soil overlays the Carboniferous Crackington Formation (a division of what has historically been termed by geologists as the “Culm Measures”) which primarily consists of clay shales that when saturated with water, readily degrade to form clay. The combination of high annual rainfall coupled with a clay subsoil with <10 mm d-1 hydraulic conductivity means that the soils are waterlogged for most of the winter season. As a result, excess rainfall is only removed via overland surface runoff and sub-surface lateral flow. The experimental site originally consisted of twelve plots in two blocks of six, each of 1 ha. In 1987, a previously unfertilized area of adjacent permanent pasture was incorporated to provide two more plots, each of 0.66 ha, that received no input of mineral N fertilizer (Fig 1). Each plot is bounded by gravel interceptors, or French drains, to isolate overland surface runoff and surface lateral flow (to 30 cm depth) so that each is hydrologically isolated from its neighbour. Half of the plots (7) were drained to 85 cm by tile drains at 40 m intervals across the slope, overlain by mole drains at 2 m spacing and a depth of 55 cm down the slope (Fig 2). This design represents a typical form of field drainage management under these soil and hydrology conditions. A full description of the set-up can be found in Armstrong et al. (1984) and Armstrong and Garwood (1991). The site is included on the register of long-term ecological field experiments (LTEs) maintained by the Ecological Continuity Trust https://www.ecologicalcontinuitytrust.org/rowden-plots and on the Global Long-Term Agricultural Experiment Network (GLTEN) https://glten.org/experiments/63.

Data collection

Water discharge as either surface runoff/sub-surface lateral flow, or through field drains, is channelled from each plot through ½ 90° V-notch weirs (BSI, 1981). Drained plots have two weirs; one to monitor surface runoff/sub-surface lateral flow and one for the field drainage pathway. The undrained plots have only one weir to monitor surface runoff/sub-surface lateral flow. Thus, there are twenty-one weirs in total.

Changes in stage height (water height) within each weir were measured with a resolution of 0.2 mm using Starlevel sensors (Unidata Model 6541 Precision Water Level instrument). Changes in stage height were automatically recorded at 1 minute intervals by a logger (CR200X, Campbell Scientific Europe, Loughborough, UK) with an internal 900 MHz spread-spectrum radio to transmit the data to an onsite PC with collection controlled using Loggernet software (Campbell Scientific Europe, Loughborough, UK).

The rainfall data was collected from two different instruments; from an Automatic Weather Station and a Rainwise rain collector coupled with a RainLog (Rainwise, Bar Harbor, Maine,USA) both sited on the Rowden site. Rainfall data are given on an hourly timestep, with rainfall volume (mm/hr) for the 60 minute period preceding the date and time stamp.

Data preparation and processing activities

The stage height recorded by the Starlevel sensors at zero flow was periodically checked against the stage height at the V-notch using a metal rule. If the difference in the reading was > ±1 mm, then the stage height reading was manually adjusted back to 0 and the required adjustment value recorded. The stage height data collected between the checks was corrected accordingly by the adjustment value during processing.

The stage-discharge relationship (with discharge as L s-1s) was derived using average steady state data obtained from manual calibration of the weirs at different stage heights. During a period of no runoff/drainage from the fields, a tanker was used to feed water into the weir, the flow of which was controlled by a valve fitted to the end of the inlet hose. Low flows were measured by collecting discharge from the weir in vessels appropriate in size to the flow rate and recording the volume and time taken to fill the vessel. For high flows, discharge was measured using an electromagnetic flowmeter fitted to the end of the inlet hose. At least 10 measurements were taken at each flow rate tested to account for levels of uncertainty due to operator and measurement error. The uncertainty in the stage-discharge relationship was determined using a modified fuzzy rating curve approach and the resultant rating curve envelope can be interpreted as the min / max discharge intervals at any given stage. Full details of the calibration methodology, results and calculation of uncertainty are given in Krueger et al. (2010).

The stage height data were processed using a suite of bespoke Matlab scripts which checked for missing timesteps and infilled these with ‘NA’, adjusted the stage heights if required using data obtained from the zero flow check described above, and calculated the discharge in L s-1 as uncertainly intervals based on the interval data from the stage-discharge relationship described above. The discharge data were then converted to mm min-1 using the following equation:
mm min-1 = L s-1 * 60 / plot area (m2)
Missing or suspect values are indicated as NA in the data sets.

Additional information:
High-resolution hydrology data enhances the accuracy of modelling and prediction tools allowing improved understanding of water resources, whilst supporting the development of resilient and adaptive approaches to water management in various sectors, including agriculture, industry, and urban planning. For example, in the UK the management of flood risk from new developments is integral to the planning process and guidelines require that the peak flow from these sites should not exceed that which would occur pre-development (Greenfield) conditions. The high-resolution data described in this paper have been used to test the accuracy of the methodologies used to estimate Greenfield flow, the results of which showed that the methods significantly underestimate peak flows (Rodda and Hawkins, 2012).

Rowden Lysimeter Plot Areas (m2):
Plot No. Area (m2) Hydrology
1 6655.33 undrained
2 6814.56 drained
3 10090.53 drained
4 10343.25 drained
5 10197.66 drained
6 9894.33 drained
7 9748.71 undrained
8 10189.70 undrained
9 10029.02 drained
10 9935.04 undrained
11 9815.71 undrained
12 10059.63 drained
13 9992.46 undrained
14 9827.38 undrained
Undrained plot numbers: 1,7,8,10,11,13,14
Drained plot numbers: 2,3,4,5,6,9,12

Additional references:
Armstrong, A.C., Atkinson, J.L., Garwood, E.A., 1984. Grassland drainage economics experiment, N. Wyke, Devon. MAFF, London.
Avery, B.W., 1980. Soil classification for England and Wales. Soil Survey, Rothamsted Experimental Station, Harpenden, Hertfordshire, UK.
Boorman, D.B., Hollis, J.M., Lilly, A., 1995. Hydrology of soil types: A hydrologically based classification of the soils of the UK. Institute of Hydrology, Wallingford, UK.
BSI, 1981. Methods of measurement of liquid flow in open channels. Part 4A: Weirs and flumes; Thin plate weirs and Venturi flumes. Methods of measurement of liquid flow in open channels. British Standards Institution:, London, United Kingdom, pp. 1-30.
Krueger, T., Freer, J., Quinton, J.N., Macleod, C.J.A., Bilotta, G.S., Brazier, R.E., Butler, P., Haygarth, P.M., 2010. Ensemble evaluation of hydrological model hypotheses. Water Resources Research 46. (https://doi.org/10.1029/2009WR007845).
USDA-SCS, 1975. Soil Taxonomy: a basic system for soil classification for making and interpreting soil surveys. USDA Agricultural Handbook 436. USDA Soil Conservation Service, US Department of Agriculture, US Government Printing Office, Washington DC, USA.

Permalink - https://repository.rothamsted.ac.uk/item/98y67/high-resolution-flow-datasets-for-surface-runoff-surface-lateral-runoff-and-drainage-pathways-from-1-ha-sized-hydrologically-isolated-plots

129 total views
160 total downloads
7 views this month
16 downloads this month
Download files as zip